Visualize your data on maps
Graphically represent complex data on maps, creating dynamic heatmaps and other geo-visualizations.
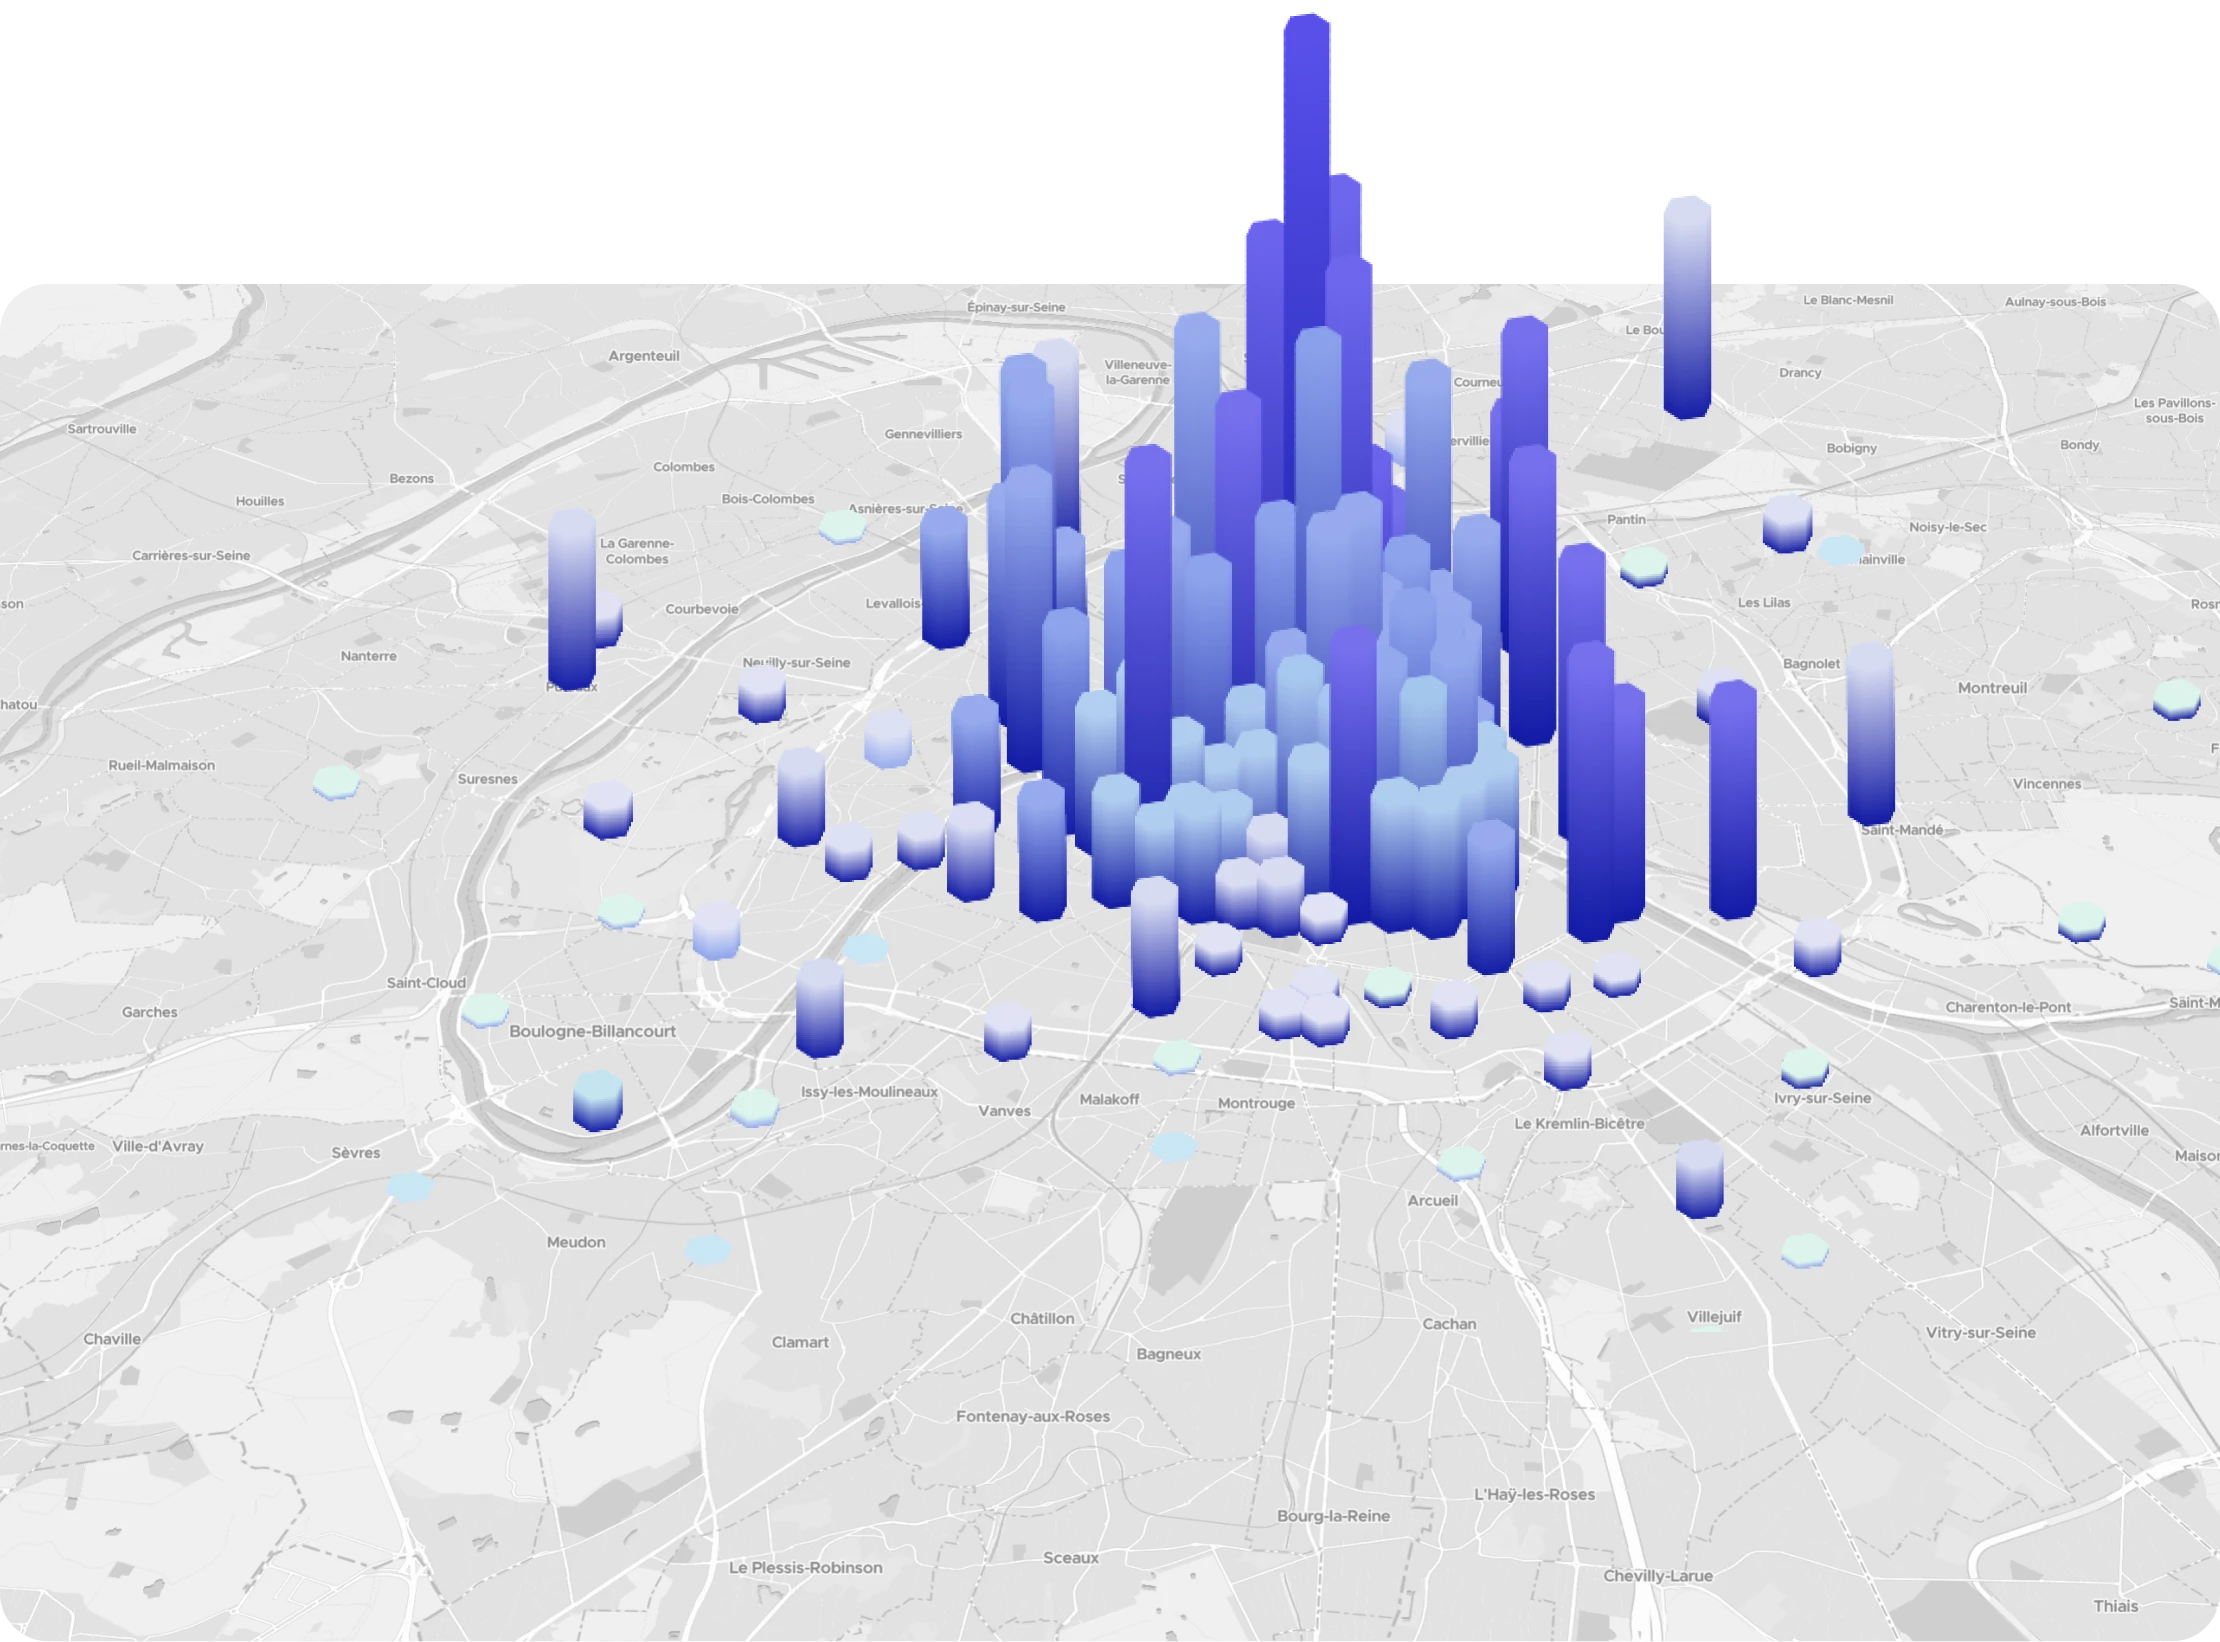
Visualize your data at scale
Showing large amounts of point data from external JSON is not a problem.
Our algorithms can do clustering on the client side or render heatmaps on the fly.
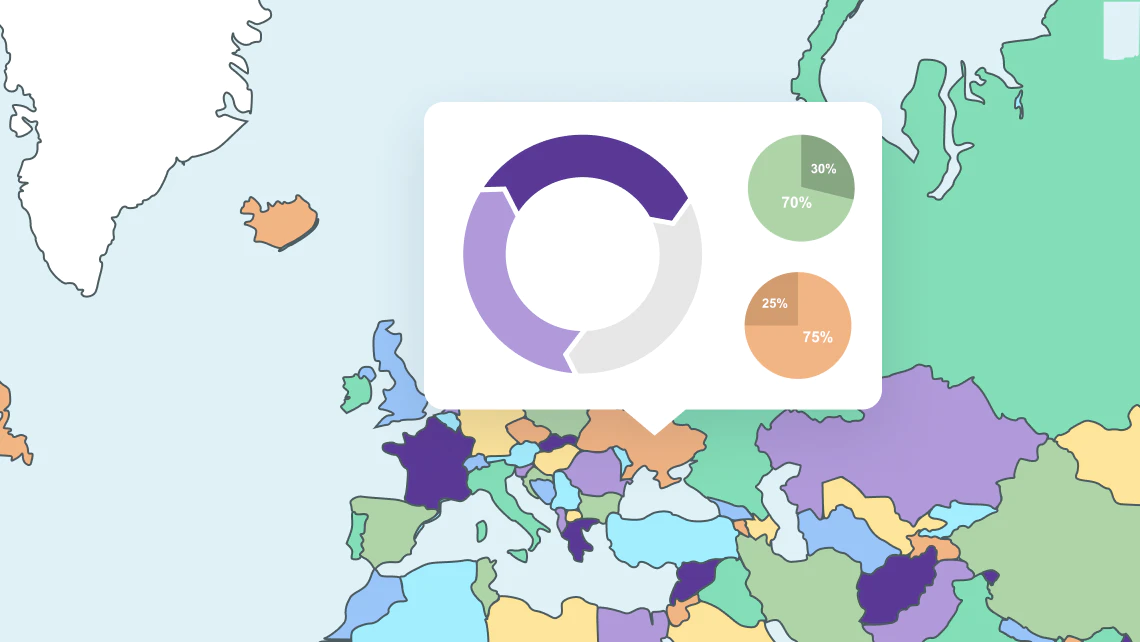
Connect the Map with your analytics
Users can click on the map to access more detailed information within the dashboard. This feature can enhance the user experience and make data analysis more efficient.
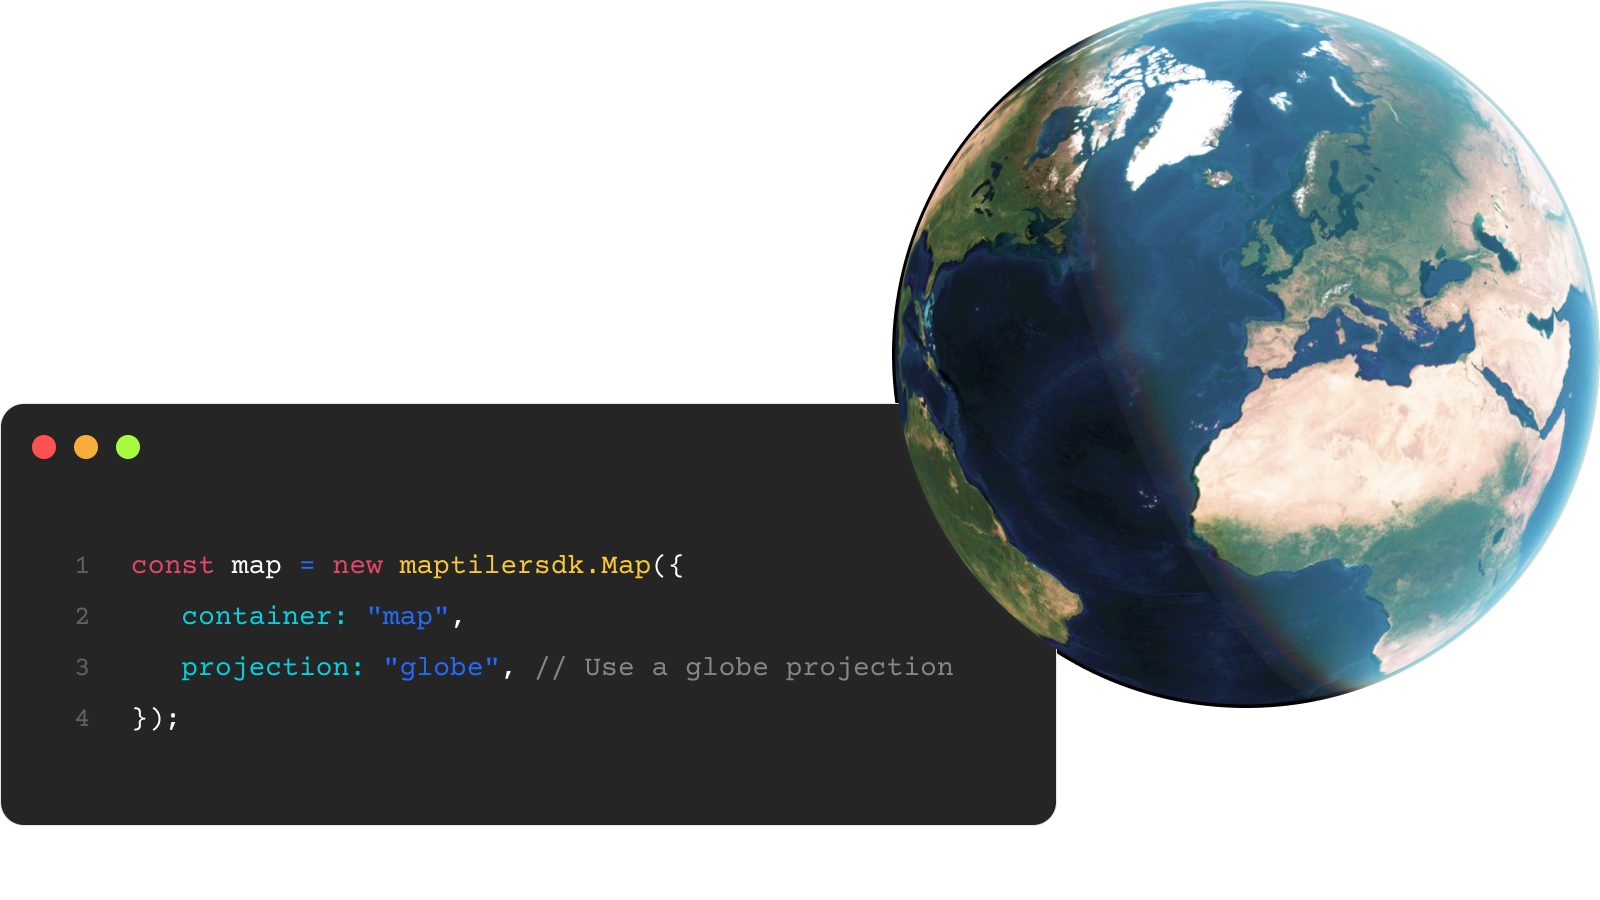
Globe maps
Turn flat maps into globes with one line of code!
Show your global statistics data, undersea cables, shipping routes, and flight paths without the distortion of the Mercator projection.
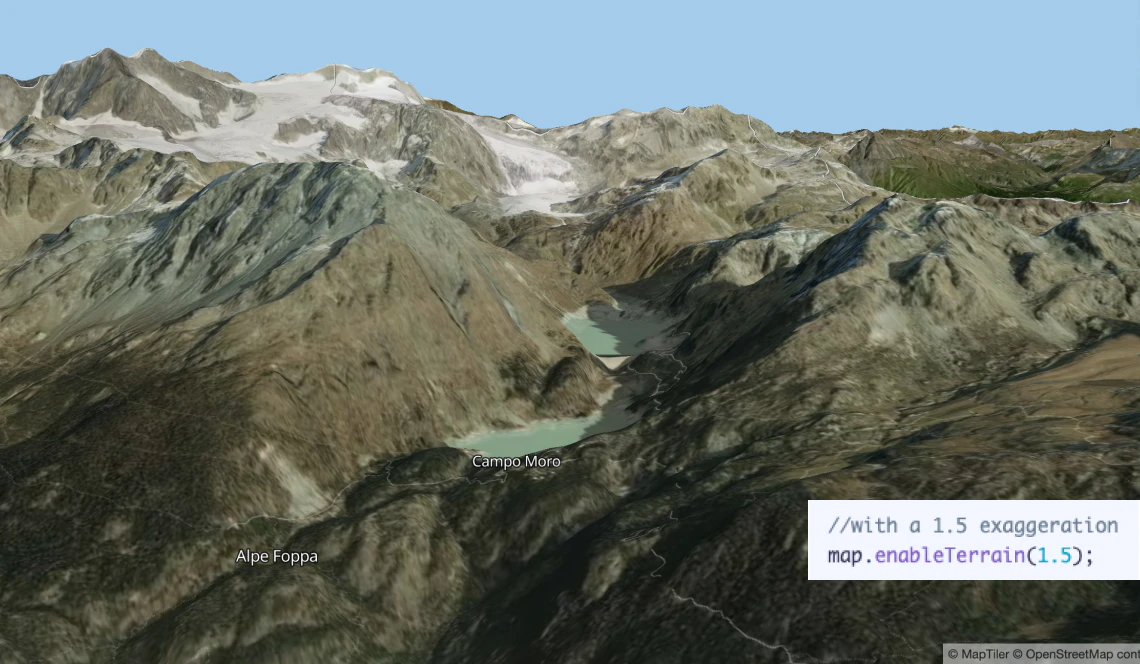
3D terrain in one call
Add depth and realism to your maps with 3D mountains. Using MapTiler SDK that takes just one line of code! No need to set up data sources. Perfect for hiking and tracking applications.
SDK modules
Explore modules to extend functionality of our SDK


Add interactive controls
Build interactive maps with our SDK:
- Add clickable markers for features on the map
- View mountains in augmented reality
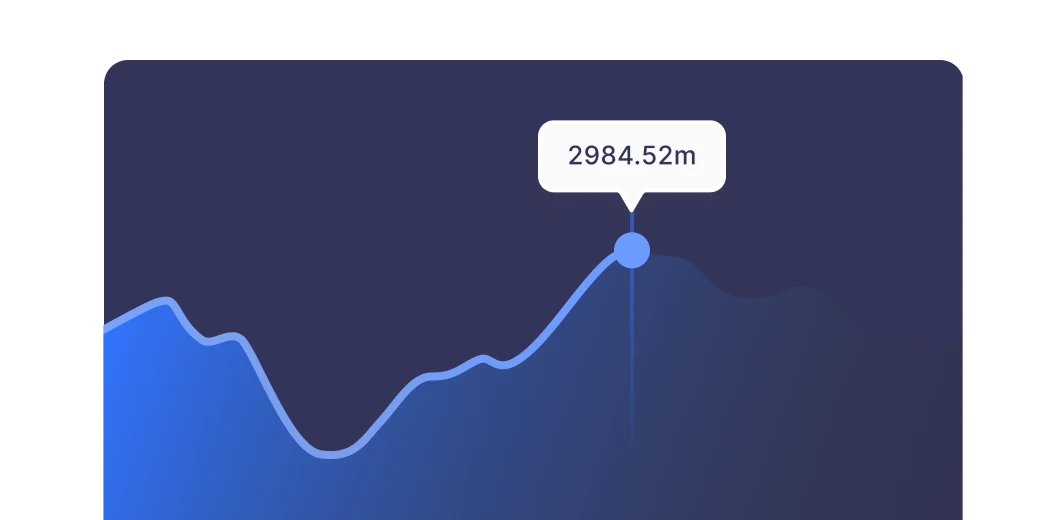
- Create elevation profiles for hiking routes

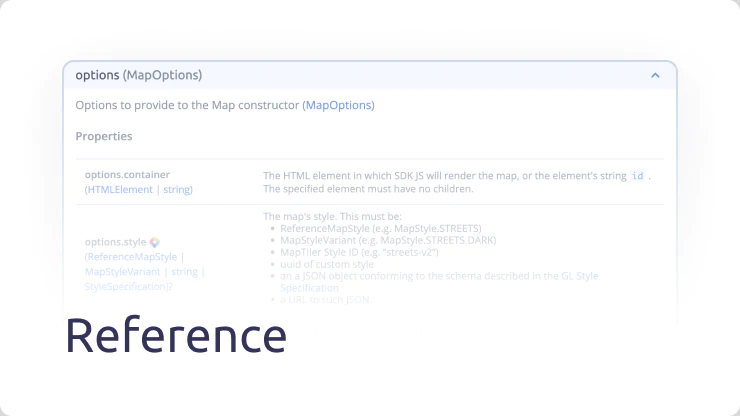
JavaScript Maps API
MapTiler offers a comprehensive set of APIs that enable developers to create mapping applications that are great to look at and user-friendly. With these APIs, your maps will be able to provide a seamless user experience that is sure to impress. All of them are integrated in MapTiler SDK.
Resources