
Weather SDK for maps
Add weather visualizations to your maps with animated forecast layers
Use your own data in 3D and enhanced tools with our Weather Plus service
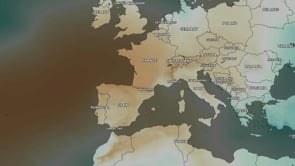
Free Weather Layers for MapTiler SDK maps
Add current weather and five day forecast layers to your map with a few lines of code
Get location specific weather information using the cursor, with text based searching coming soon
Frequently updated weather layers are available in MapTiler Cloud, usable with MapTiler SDK
Included in your MapTiler Cloud plan, usage counts towards your sessions: Calculate your costs


Loading ...
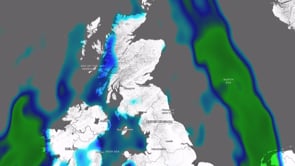
Everything you need to make a weather map

Weather datasets
- Current weather and a 5 day forecast
- Data in hourly intervals, updated every 6 hours
- 28km resolution data
- Upgrade to Plus to access more advanced visualizations and data: Contact sales

Weather SDK

Ready-to-use maps
- Use preset map styles designed specifically to highlight weather data
- Switch between dark and light themes
- Cost savings compared to Mapbox and Google Maps
High-quality weather icons
Add custom weather icons to your maps in an organized way:
- Use raster icons, animated SVGs, or even Lotties
- The markers don’t overlap or crowd the map
- Customize them with location names and other attribute data
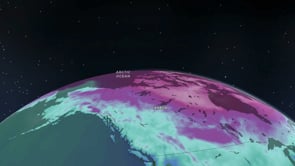
Weather maps on a globe
Visualize hurricanes and other large-scale weather phenomena on a globe. Weather maps are much more realistic when viewed in their true context on the surface of a globe!
- Show hurricanes and other massive storms cross oceans
- Compare temperature differences across continents
- Highlight how seas and mountain ranges influence the weather
Trusted by

Wetter.com: Maps for forecasts
Wetter.com displays weather related information as an overlay on top of base maps provided by the MapTiler Cloud service.
MapTiler base maps can be used as a background to provide context to any spatio-temporal information, including real-time weather forecasts.

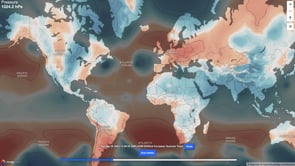
Advanced weather maps
Particle animation in WebGL
Create wind visualizations with particles clearly showing direction and speed.
Visualize movement and change over time: the MapTiler Weather library can smoothly animate the changing course of the wind.
Animations run in any contemporary web browser using WebGL.
Smooth vizualisations
Animate at 60FPS with hourly data intervals and interpolated frames between.
28 km (18 miles) resolution smoothed for viewing at all zoom levels
Add weather layers to your maps now
Get a MapTiler Cloud account and access the weather layers; it’s free for non-commercial use.
Weather Plus
Display dynamic visualizations of isolines and arrow particles, custom weather data, 3D visualizations, and more.
Weather | Weather Plus | |
Availability | All MapTiler Cloud plans, including Free | Contact us |
Access to pre-processed MapTiler Weather layers | ||
5 day forecast, updated every 6 hours | ||
Resolution | 28 Km (18 mi) | As high as your own data allows |
Particle Animations | ||
Smooth visualisations up to 60FPS | ||
Visualize your own custom weather data | ||
Interactive 3D visualizations | ||
Advanced visualizations: Animated Isolines, Arrow particles |
Weather | |
Availability | All MapTiler Cloud plans, including Free |
Access to pre-processed MapTiler Weather layers | |
5 day forecast, updated every 6 hours | |
Resolution | 28 Km (18 mi) |
Particle Animations | |
Smooth visualisations up to 60FPS | |
Visualize your own custom weather data | |
Interactive 3D visualizations | |
Advanced visualizations: Animated Isolines, Arrow particles |
Weather Plus | |
Availability | Contact us |
Access to pre-processed MapTiler Weather layers | |
5 day forecast, updated every 6 hours | |
Resolution | As high as your own data allows |
Particle Animations | |
Smooth visualisations up to 60FPS | |
Visualize your own custom weather data | |
Interactive 3D visualizations | |
Advanced visualizations: Animated Isolines, Arrow particles |
Interested in the added benefits of Weather Plus? Contact Us.
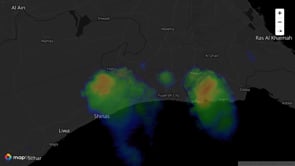
Bring your own weather data
Develop weather maps quickly and easily using your data and our mapping environment.
Use our advanced visualization tools and beautiful backdrop maps to maximize the impact of your weather data.

Interactive 3D Vizualisations
Build animated 3D weather visualizations to analyze radar data.
Use the customizable cutting tool to see inside storms.
Use vertical exaggeration and real time rendering controls to show more detail and control loading times.
Dynamic visualization tools
Premium visualizations created automatically from the data.
Add isolines to your air pressure maps with automatic high and low spot detection.
Add arrows to your animated particles to clearly indicate direction of air flow.
Build bespoke interfaces with Weather Plus now
Get in touch with our team to find out how we can help you create a unique weather experience.