UPDATE: Everyone loved this blog post so much we created the map datasets for you! Read all about how to use MapTiler Ocean in this new post: Map the Ocean with MapTiler
Most web maps usually focus on the land features, and the ocean is often left as a flat blue polygon. Let’s change that and make it look better! Here are a few simple steps to create bathymetry vector tiles with MapTiler Engine and map the ocean depths on MapTiler Cloud.
Creating bathymetry vector tiles
Ocean depth data can be found on the bathymetry section of the NaturalEarth website. Global nested polygons are downloaded as individual shapefiles, each of them coming with a DEPTH attribute from 0 to -10000 meters.
Although this data can be processed as it is, we would rather merge all the shapefiles together first in QGIS, and dissolve polygons by depth. That allows to provide a single input data source to MapTiler Desktop and makes processing faster. We then only need to adjust the desired zoom levels (z0-z5) and launch rendering to get optimized vector tiles in a few minutes.
The result is then directly uploaded to MapTiler Cloud, and a new tileset is subsequently created in the Tiles section of the related account. Processing bathymetry vector tiles with MapTiler Desktop
Mapping the ocean depths
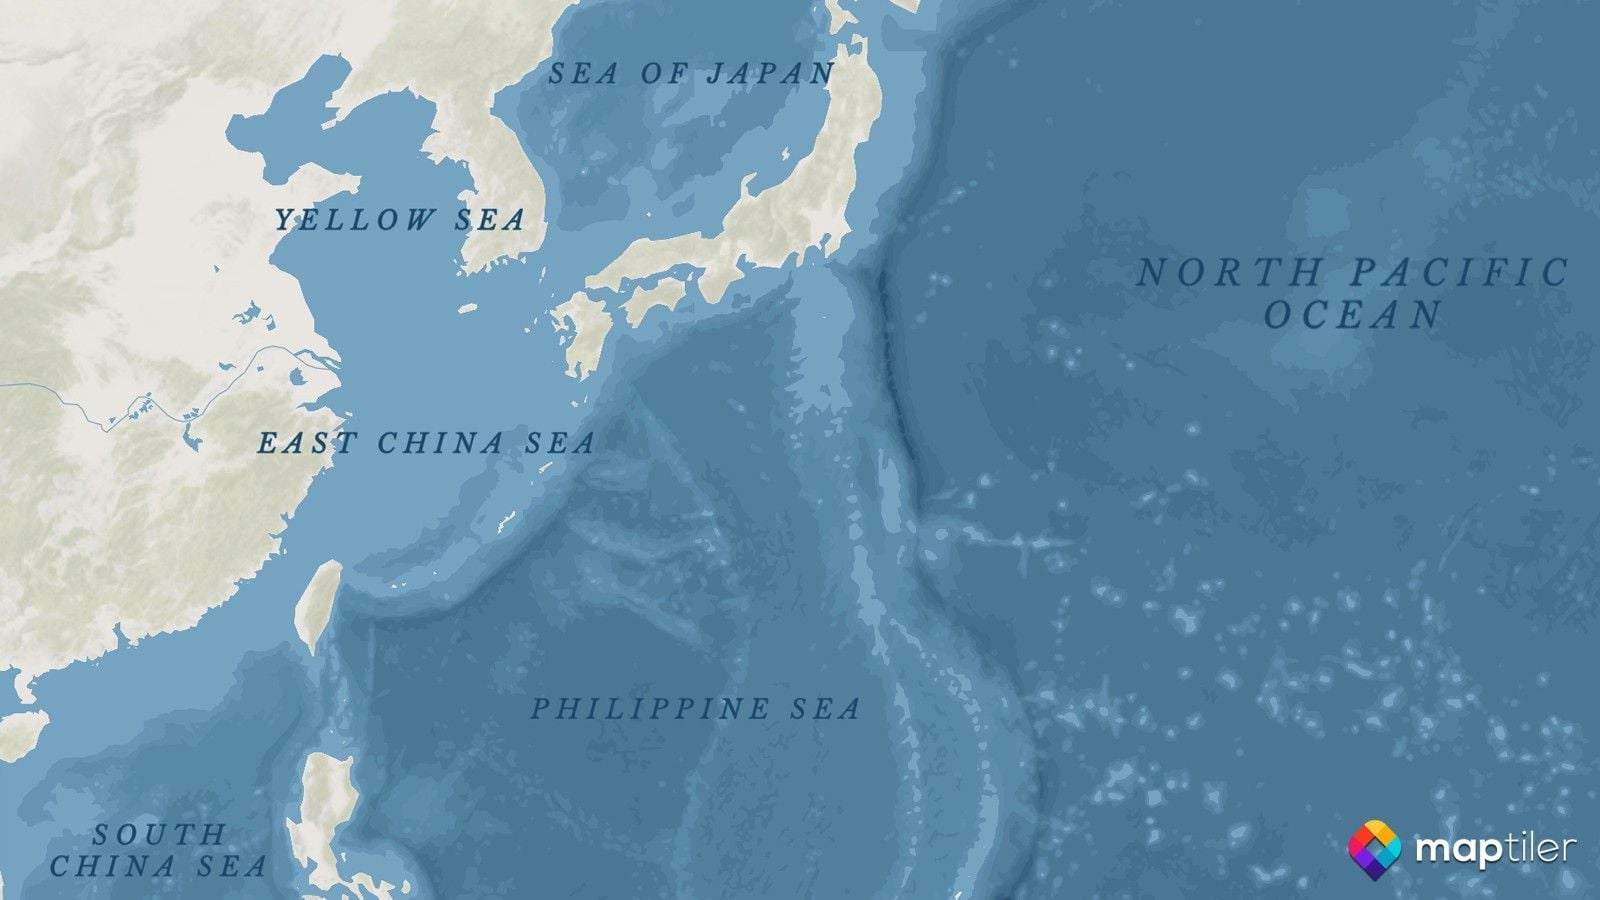
A map can now be created with a single fill layer using the new bathymetry tileset referenced as data source. A straightforward way to style it is to use a data expression for the fill-color property, which interpolates two color codes across the minimum and maximum DEPTH values. We may also define a color for every DEPTH value using a standard match expression, for full control on the rendered color palette.
The same bathymetry layer may be used in a line layer added on top, for highlighting the styled depths polygons. We may finally also use it in a symbol layer with a line placement to display the depth value labels on the map. Example style expression in MapTiler Cloud advanced editor
Publishing the vector ocean map
You may add this data and style to any MapTiler map, or use it as a starting point to build your own ocean map. This is what we did in this example map, adding it to a simplified version of our Topo map style. Once published on MapTiler Cloud, the map is available through TileJSON, XYZ and WMTS endpoints as usual. Images of the map can also be generated using the Static Map API. These steps can easily be reproduced using the free version of MapTiler Engine and a free MapTiler Cloud account. Upgrade to one of our paid plans for faster processing and hosting larger datasets.