After a year of heavy development, we release the 11th version of our data-into-maps converting software MapTiler Desktop. The already easy to use interface was made even easier and the wizard will guide you like in a tutorial. Moreover, with the new user flow, you can start using MapTiler Desktop as a viewer for your geodata.
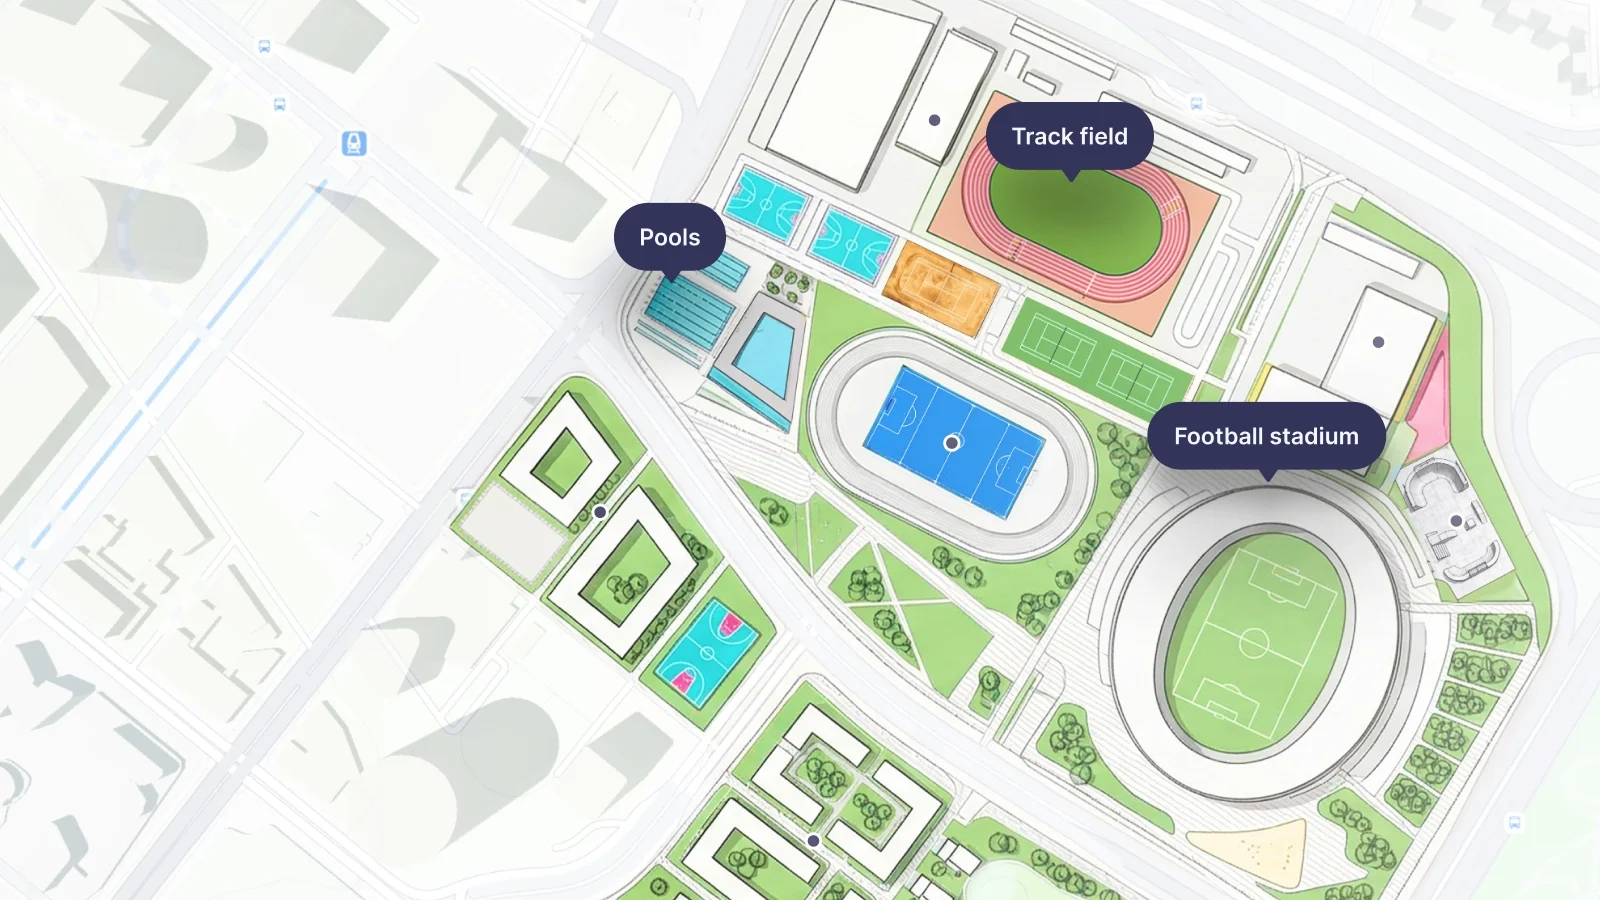
Preview any raster geodata file
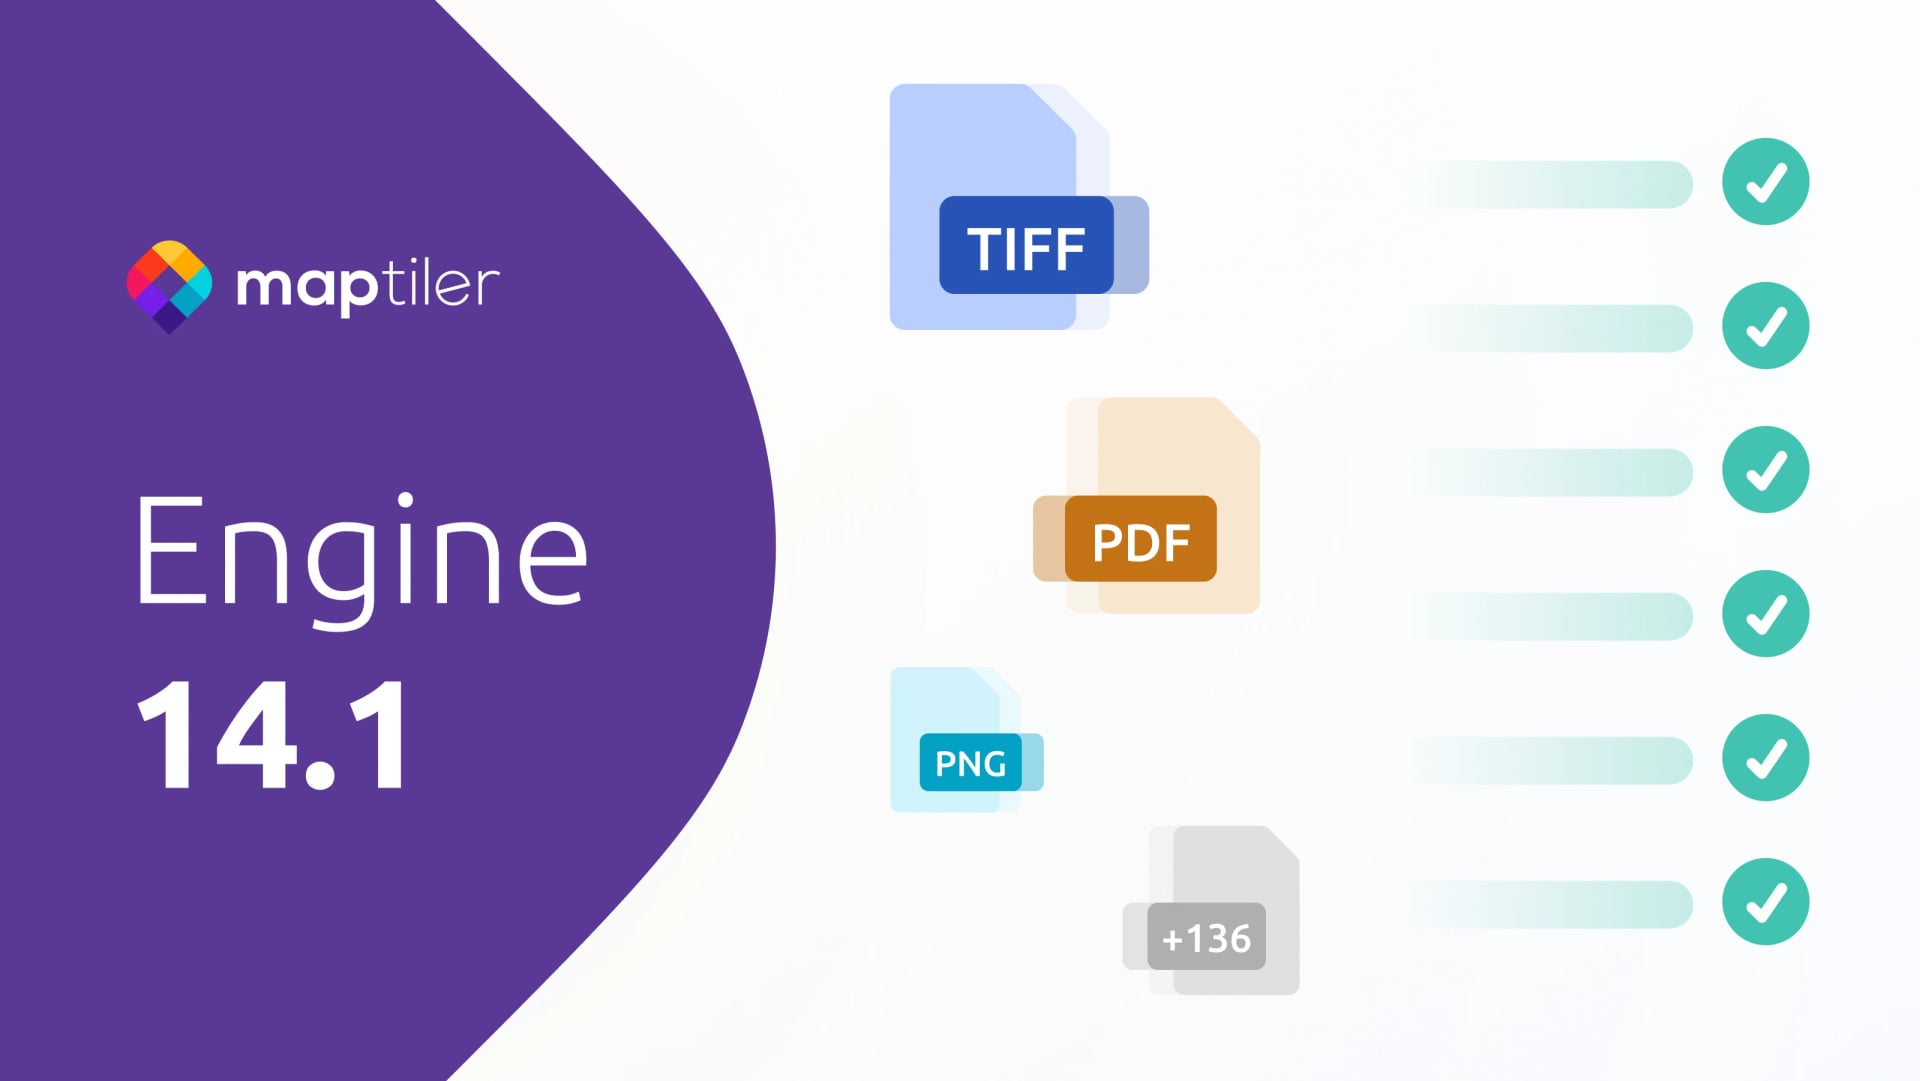
MapTiler Desktop 11 made previewing your data as easy as double-clicking on your file. If the extension is associated with MapTiler Desktop, it directly opens the preview mode where you can see your map, zoom in and out, or view a footprint of your file on top of a basemap.You can view tiled MBTiles and GeoPackages, but also browse through files which are not (yet) tiled like TIFF, PDF, JPEG, PNG, and even more exotic file formats like MrSID, ECW, JPEG2000, and others. The PRO edition can display footprints of multiple files composing a mosaic and one by one, you can view the content of each file.
The viewer shows you also things which are stored in the headers like EPSG code, resolution in pixels, and geolocation information (if they are present). After viewing your files, you can optionally continue with processing.
Wizard for generating map tiles
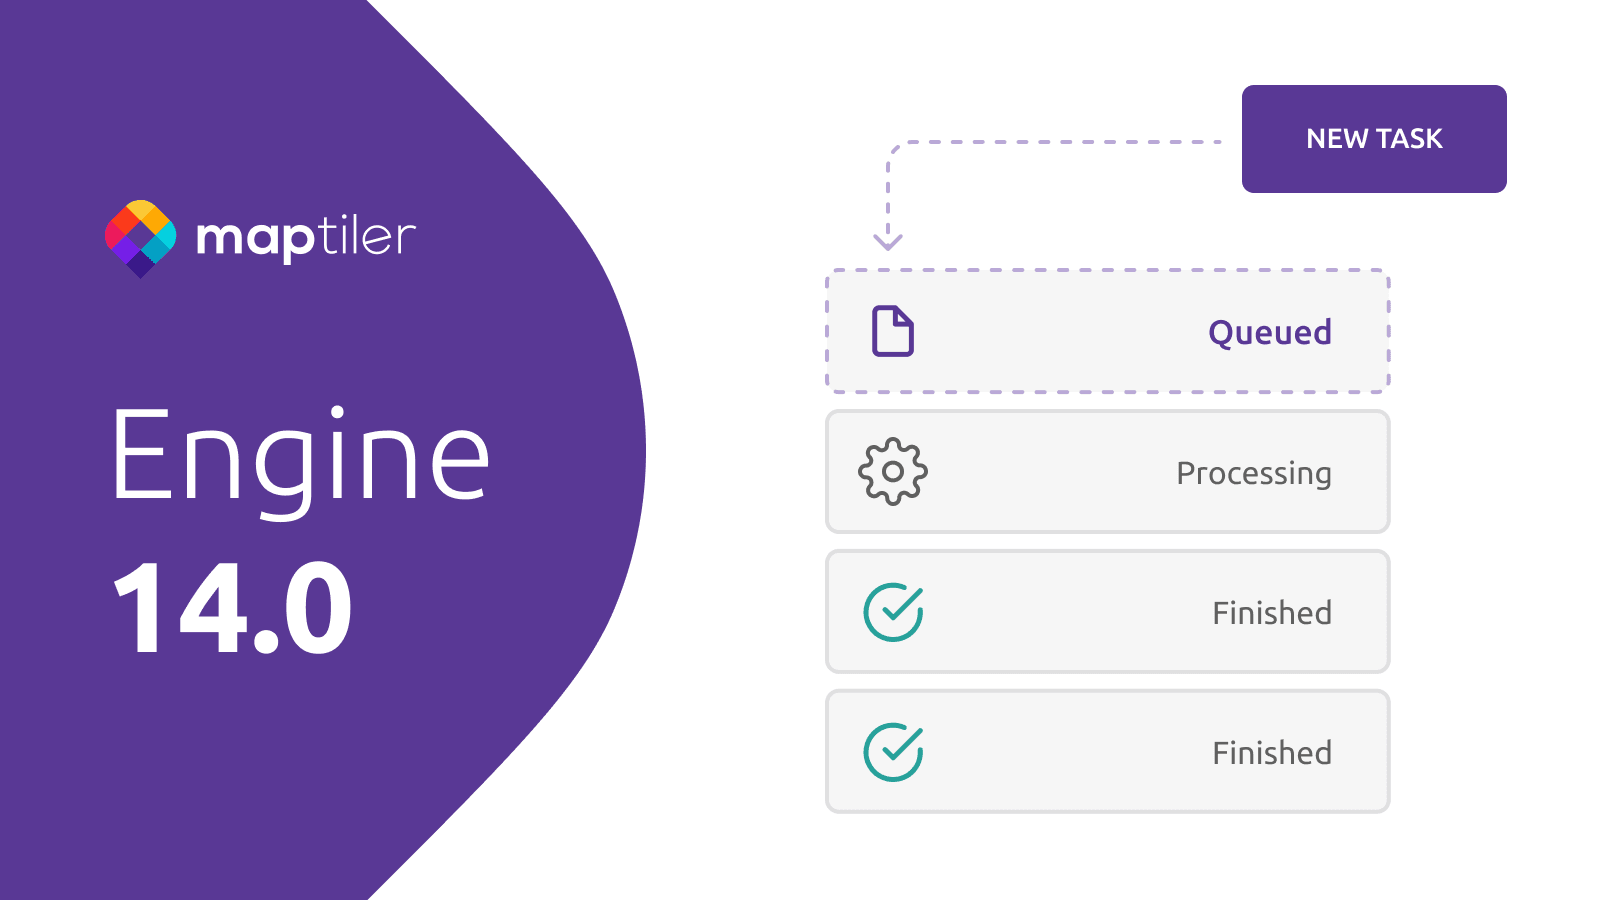
The UX changes followed one goal: to make data processing even easier. The whole process is tutorial-like: drop your files → preview them → decide what should be done with them → select output format → view the result.
If your image is already georeferenced, you don’t even have to think about anything and click “Next” like people do in the installation wizard: the program select automatically the best settings for your files (e.g. transparency settings, creating the smallest possible output, zoom levels, and others), while still giving you the full power to change it.
Vector tiles step-by-step
Processing vector tiles is no harder than raster tiles: you drop your Shapefile, GeoJSON, vector GeoPackage, or any other vector geodata, select features and attributes you want in the final map and that’s it. From raw data into vector tiles it takes less than ten clicks. Generating vector tiles is available for all users (including Free version) on all platforms, especially Windows users will appreciate this functionality since there are not many alternatives on this platform.
MapTiler Desktop is able to convert really huge amount of data. Proof? The prototype of swisstopo vector map was made using MapTiler Desktop! Viewing vector data is also possible, but the steps are a bit different. The fastest way to get a fully styled map with own colors and icons, which is optionally combined with a base map, we recommend uploading processed data into MapTiler Cloud. JavaScript viewers, mobile SDKs, WMTS for desktop GIS, or API endpoints are automatically available.
Better integration with operating system
Rewriting MapTiler Desktop using the modern Qt5 library also improved the look of the software. Now it perfectly fits into Windows and macOS environment.
Icons are now integrated into the Start menu and all files associated with MapTiler Desktop now have a matching icon.
There are installers for Windows and macOS, on Linux you can use distribution installers with DEB (Ubuntu, Debian, Linux Mint, but also Chromebooks) and RPM (Red Hat, Fedora) packages or use universal AppImage binary.
If you haven’t upgraded yet, download MapTiler Desktop 11 for your platform now, and check more changes on our web.