The position of your shop in the city, hiking trails with related points of interest, electric power grid or any other vector data can be easily displayed on a map with a few clicks.
Let’s have a look at how to import your existing files or draw points or tracks manually, add these data into a map of your choice and then embed such a map into your blog or website - without any programming at all.
Online editor for points, lines & polygons
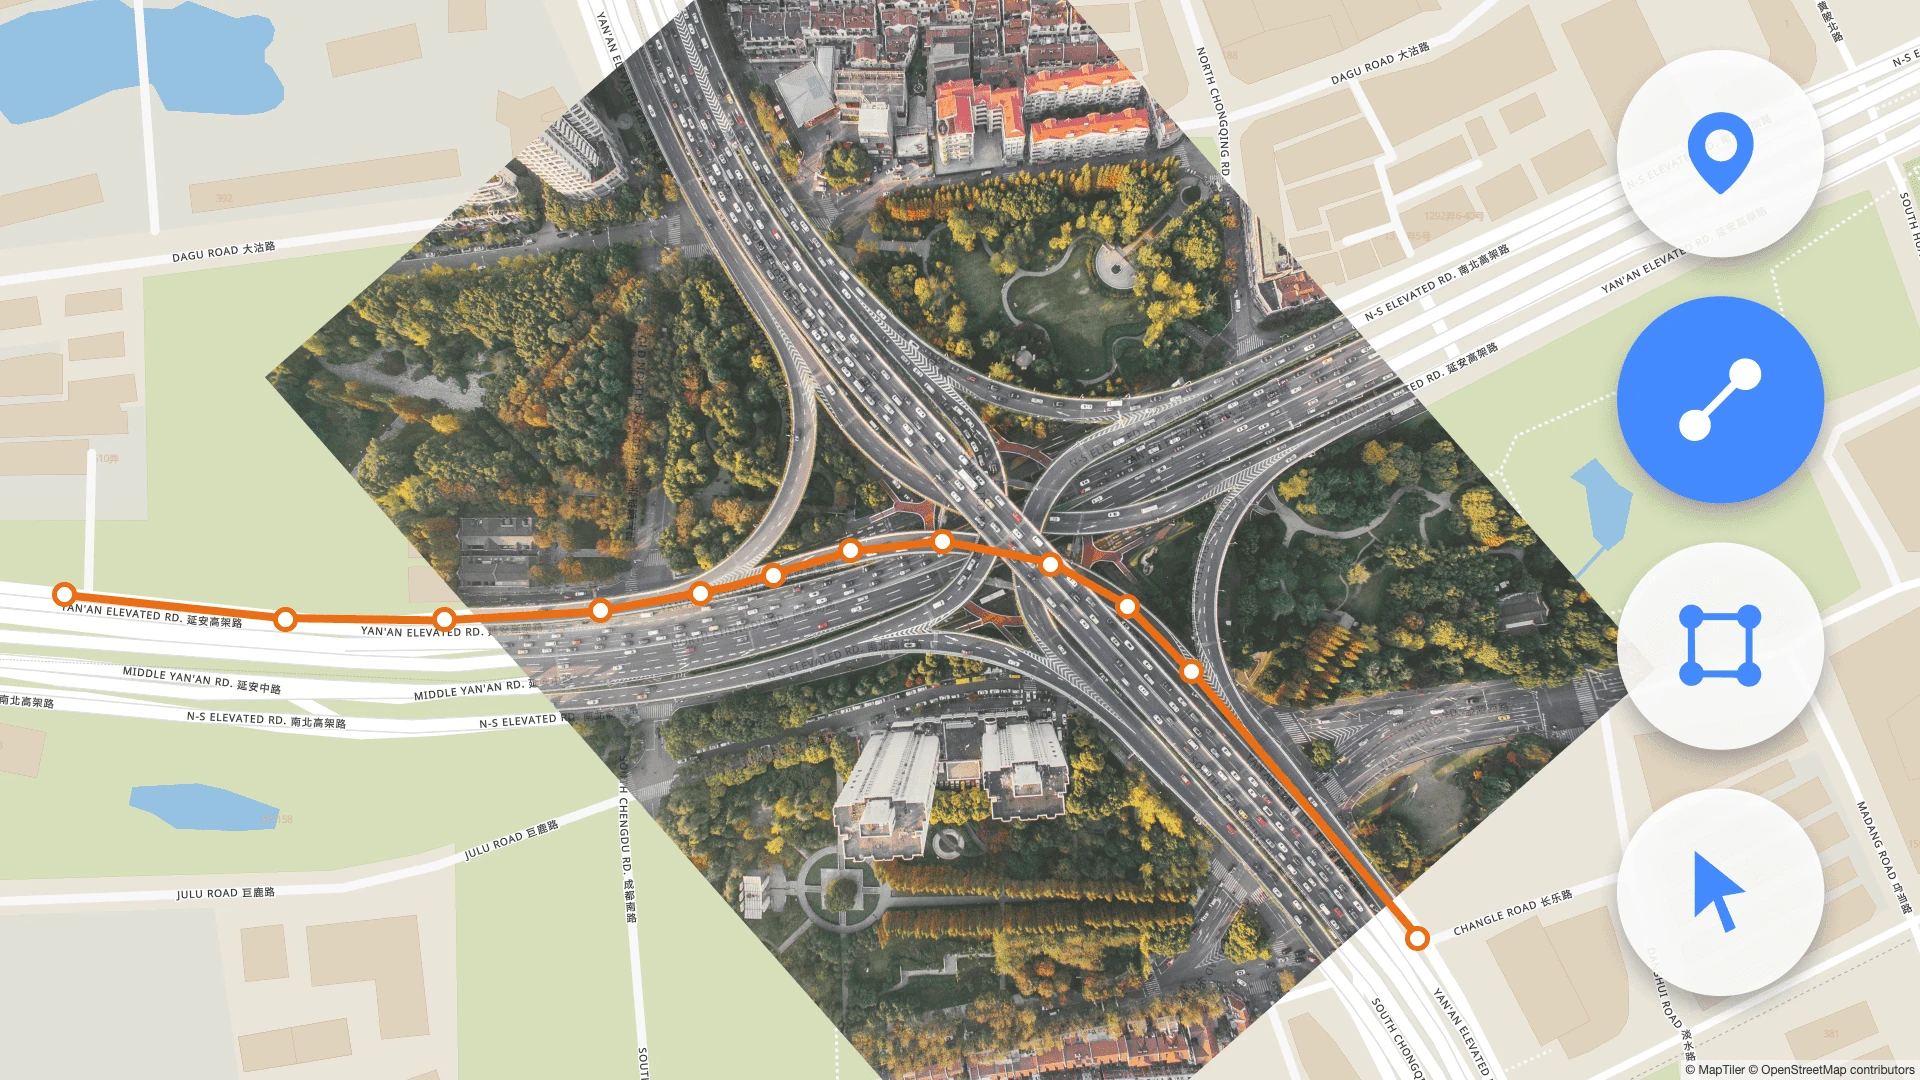
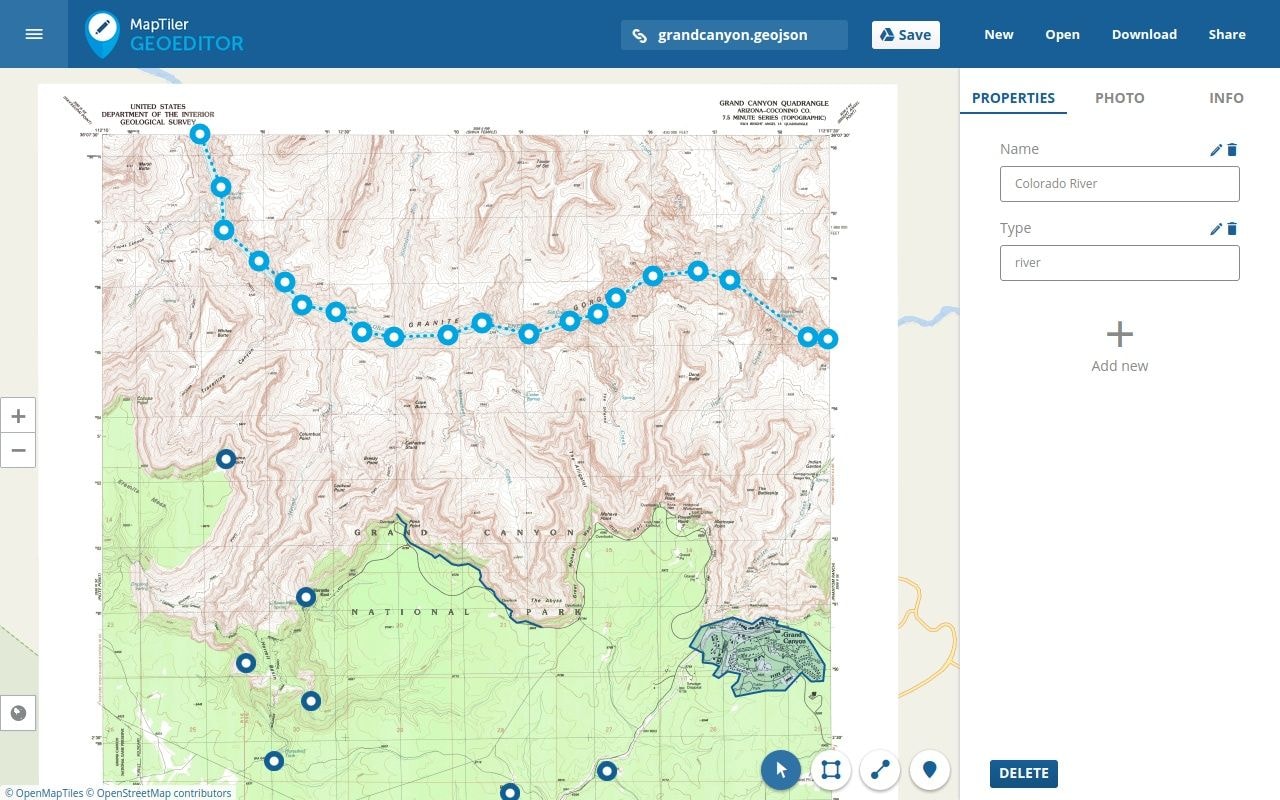
The Vector Data Editor in MapTiler Cloud allows you to create or edit your basic vector data. It is possible to start drawing your dataset or upload existing files in the following formats: .geojson, .gpkg, .gpx, .kml, .shp, .zip shapefile.
You can add points, lines, and polygons, set multiple attributes, add notes and attach photos. Instead of drawing the data on top of standard street maps you can choose a satellite map or import your scanned paper maps, floor plans or other raster geodata (just use your own map as a background).
Field data collection is possible with the free MapTiler Mobile app which allows you to record tracks and GPS positions on a mobile phone, even while offline. The data collected on a mobile phone is synchronized with the online editor.
When you are done with editing, click on the “Publish” button. This will make the data available from all our servers on 5 continents, and also allow you to add the data into other maps.
Add your data into a map
You can choose a background map that will let your data stand out. Pastel style is one of them, where light colors used in the map do not interfere with your data. There are also greyish and darkish map styles, which maximally suppress the color palette scale. You can also create own map design fitting your brand or use case with a few mouse clicks. Once you have the right base map for your data, choose the “⋮” menu and select “Edit a copy”, then add your published Data into a “Data Sources” and attach it via “Add Layer” to the map. With a few clicks, you can adjust the look&feel of the data - set colors, transparency, zoom layers on which the data appear, etc.
Detail step-by-step guide is described in a separate how-to.
Again, once you are happy with how the final map looks like, you can Save and “Publish” it to make it available on the web.
The final map can be embedded in an iframe on your web or blog, used on the web with JavaScript, on mobile devices, in desktop GIS or printed. Let’s try it yourself, no login required!