Digital elevation model (DEM) is now available in MapTiler Cloud for all users. It can be used as a base for hillshading, hypsometry, analytical appliances or 3D terrain modeling in games.
Encoded elevation data split into map tiles
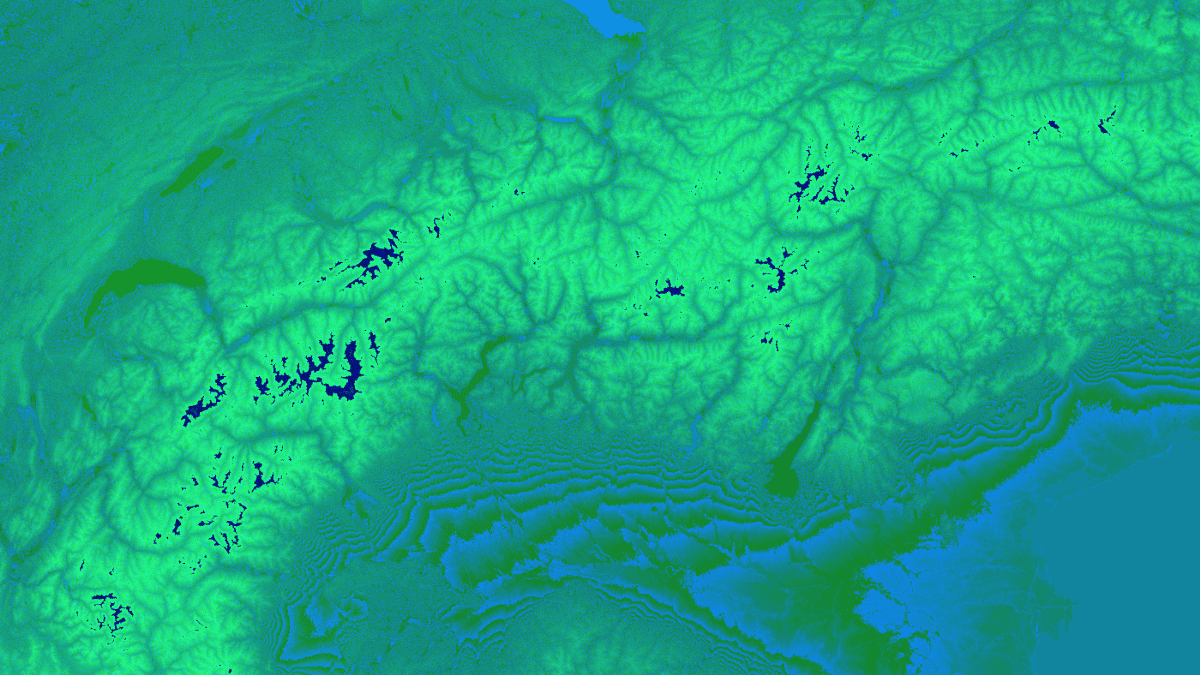
Don’t be confused by its unusual look you will see at first glance: this is not a final product meant for direct viewing yet, but a base for adaptation. Each pixel contains encoded elevation value and can be styled accordingly.
Splitting DEM into raster tiles have all the advantages of a tiled map. The main one is low traffic for web applications because the browser loads only the tiles in the current view with appropriate resolution and download additional data just in case the user zoom in or pan the map. See https://www.maptiler.com/tools/hillshading/#7/46.165/9.459
Practical applications
Each of the raster pixels contains the elevation value and it can be decoded using this formula:
height = -10000 + ((R * 256 * 256 + G * 256 + B) * 0.1)
Elevation data provides height above the sea level in meters for every single place in the world, measured for regions of approximately 30x30 meters.
Hillshading
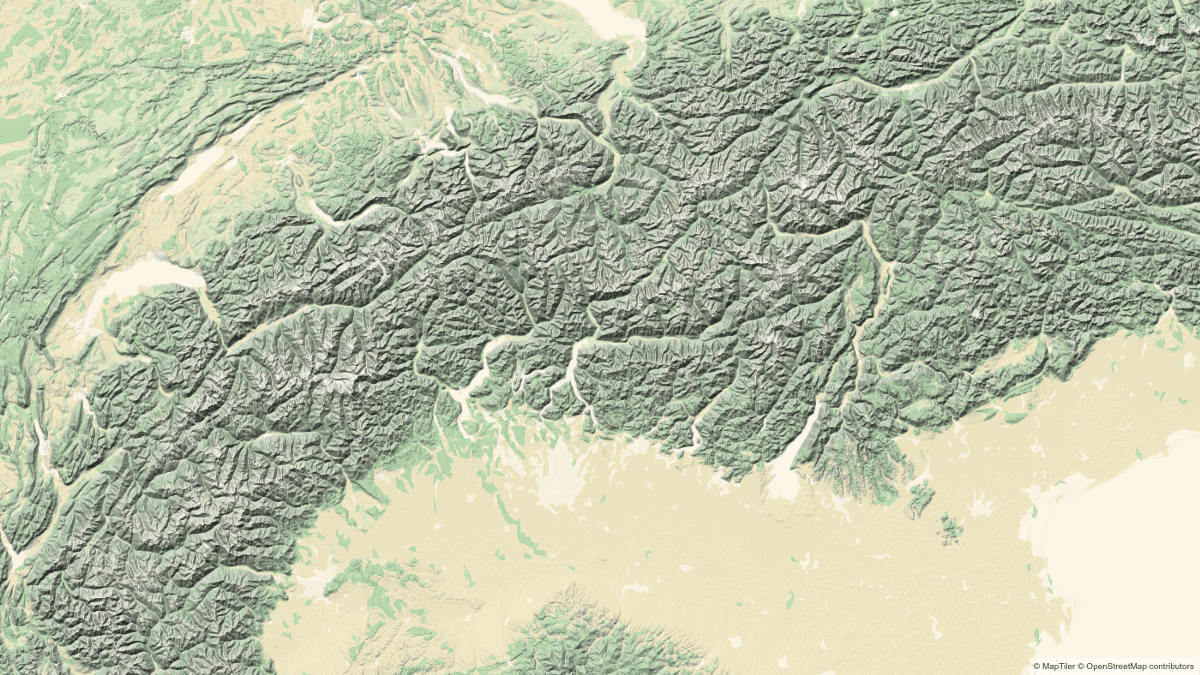
Since the data contain the encoded elevation values directly, there are many potential applications. You can add the data into your map in order to create a nice visual shaded relief for your maps.
You can even change the hillshading colors and light direction. It can be easily done in the integrated map style editor in MapTiler Cloud.
DEM hillshading is already present in our Topo map in MapTiler Cloud.
Hypsometry
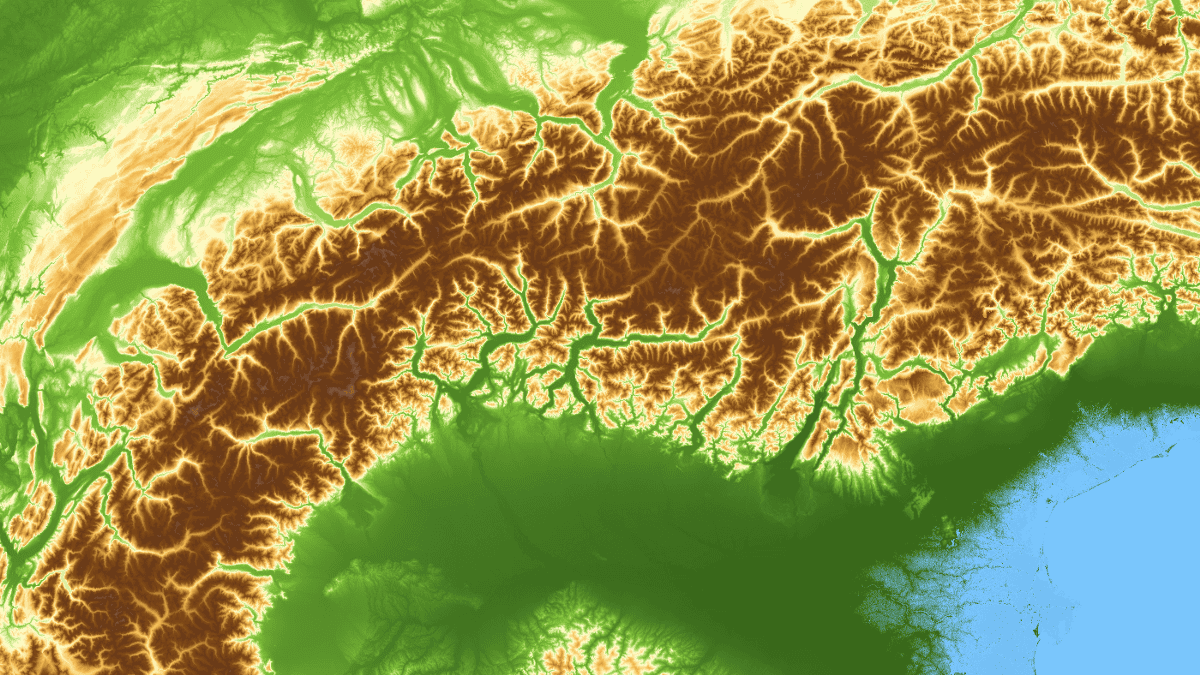
Another application where you can highlight elevation is hypsometry. The traditional color model used mostly for the relief model in geographical maps contains green color for lowlands, yellow for highlands, brown for mountains and a different tone of blue for bathymetry.
More applications
Since values can be manipulated even on-the-fly, you can create interactive tools in JavaScript. For example, we built an interactive “floods” simulator. Floods simulator you can test on https://www.maptiler.com/tools/hypsometry/#8/46.16/9.46

