Dataviz style
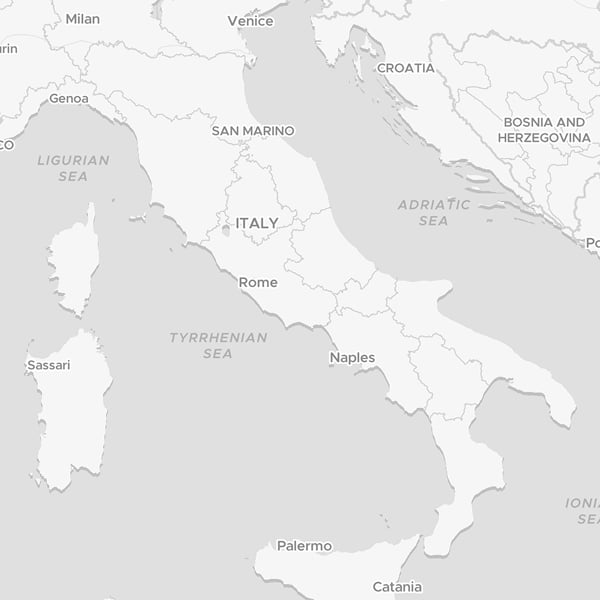
Designed to keep your data front and center, this style minimizes background noise on dashboard maps.
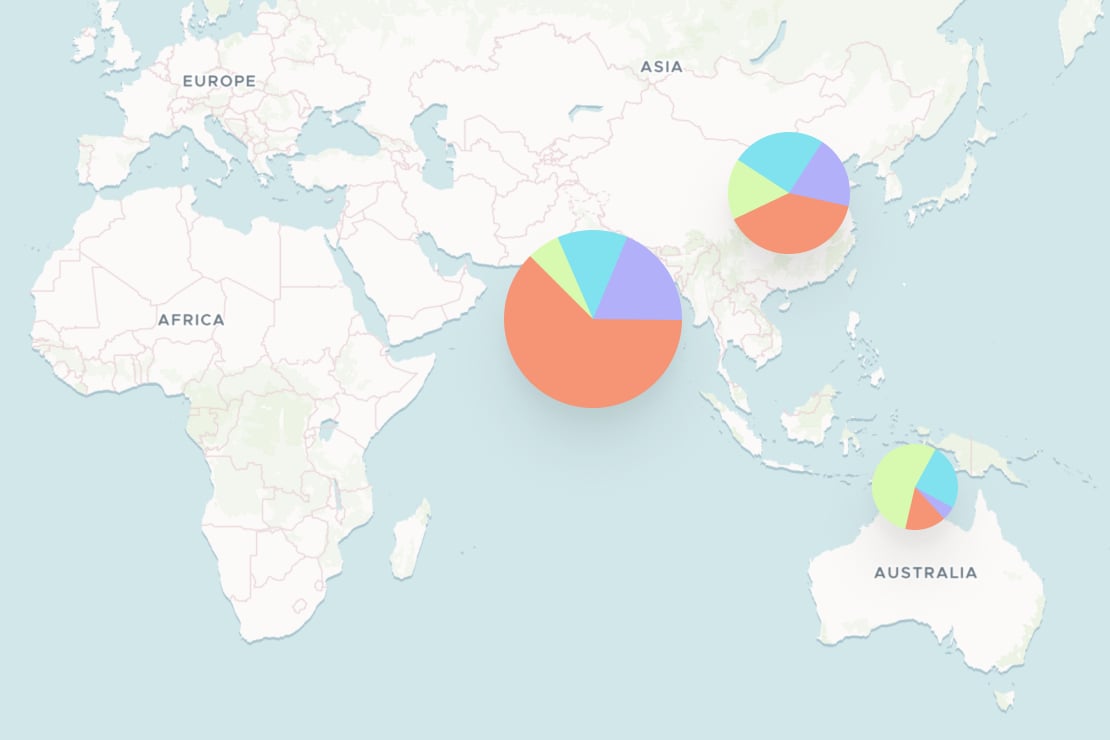
Minimalistic
Clean and clear maps that let your statistics and charts be seen with just enough context.
Adaptive style modes
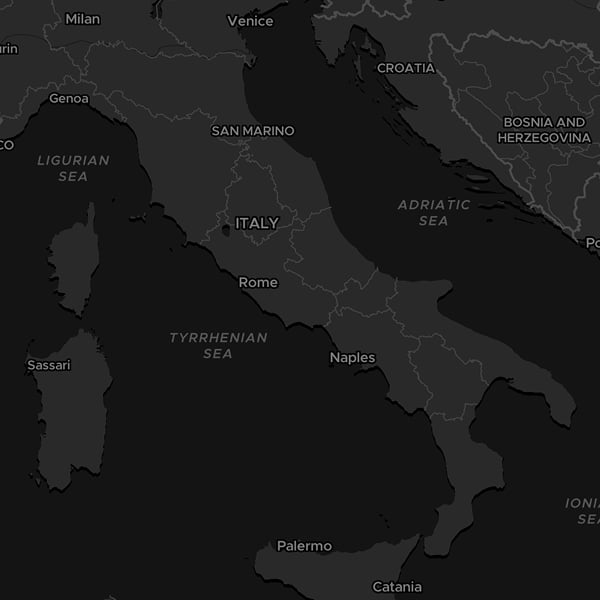
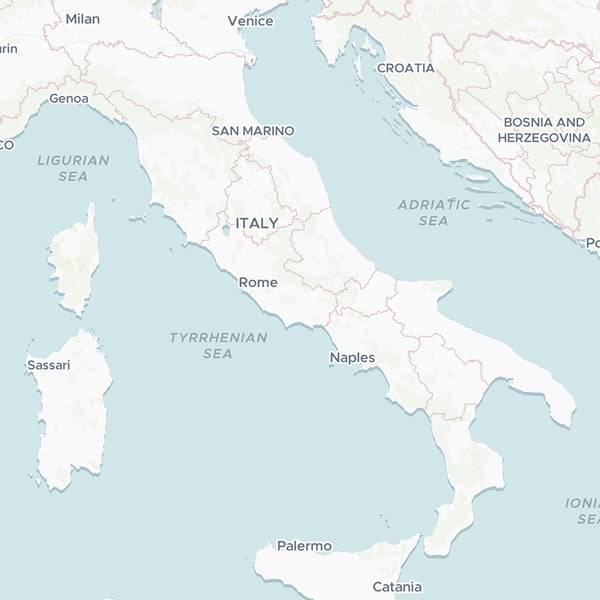
Easily alternate between light and dark styles to align with your design, user preferences, and varying light conditions.
Easily customizable
Adapt the map effortlessly thanks to its simple layer hierarchy and rich, reliable base data.
Maps for dashboards
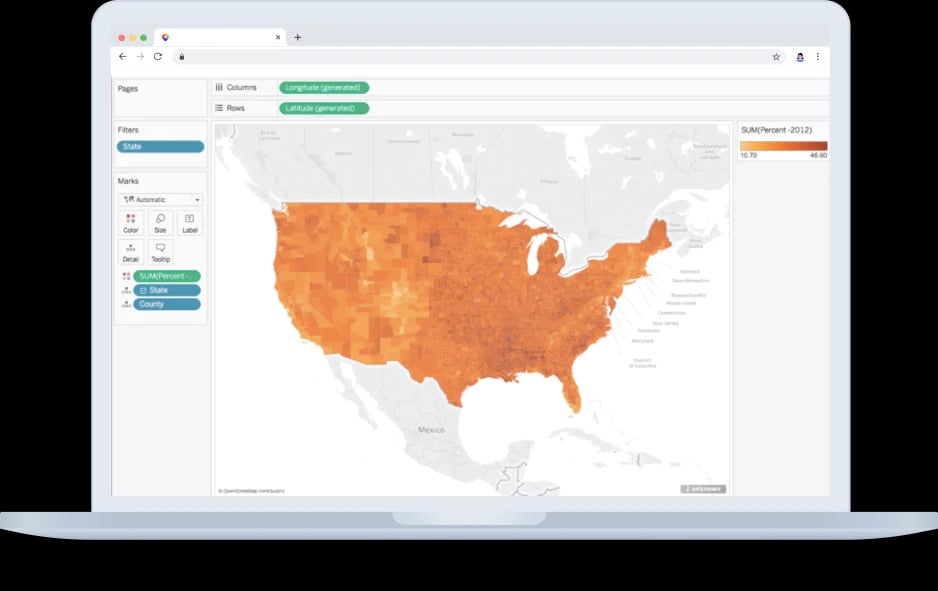
Designed to plug effortlessly into dashboards, Dataviz adds context and meaning to your data, enhancing value and unlocking insight.
Dark and light maps for data visualization
Start using one of the Dataviz style variants:
Easy integration
Dataviz is available in many formats:
- Start building applications with MapTiler SDK
- Use TMS files directly with Tableau
- Use XYZ, WMTS with Grafana or GIS software.
Build online data visualizations
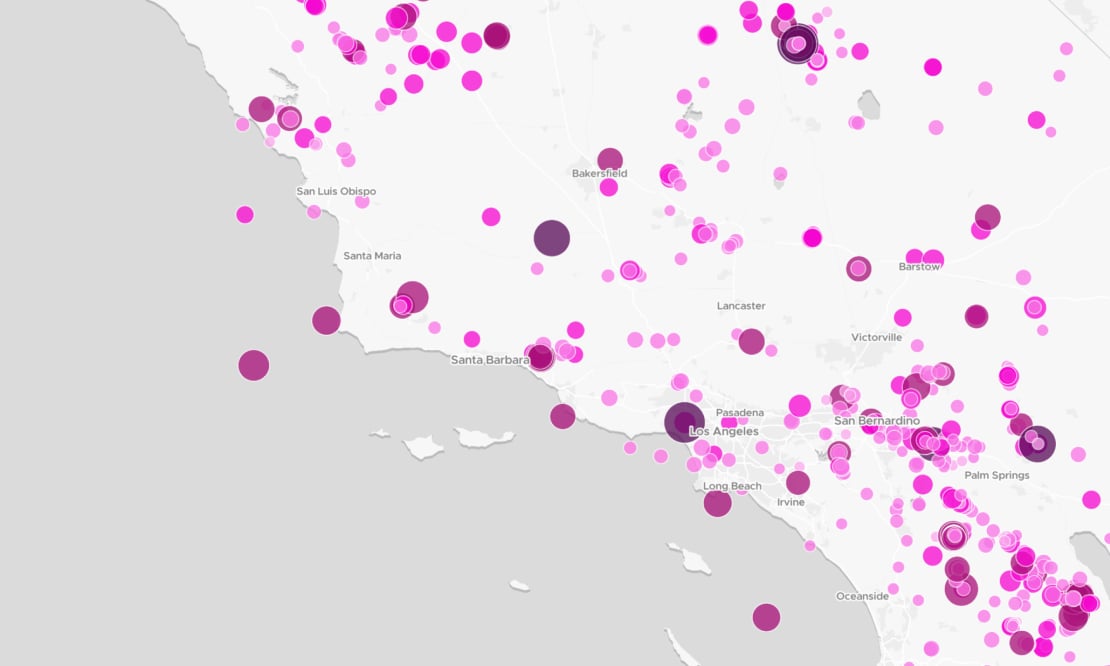
Create interactive data visualizations on the web with the MapTiler SDK:
- Effortlessly manage large datasets
- Generate dynamic heatmaps and clustering
- Apply filters and other tools to enhance your visualizations
Available as


Raster tiles
Leaflet, OpenLayers, XYZ

Map services
WMTS and OGC Tiles API for QGIS or ArcGIS

Static maps
Image for thumbnails