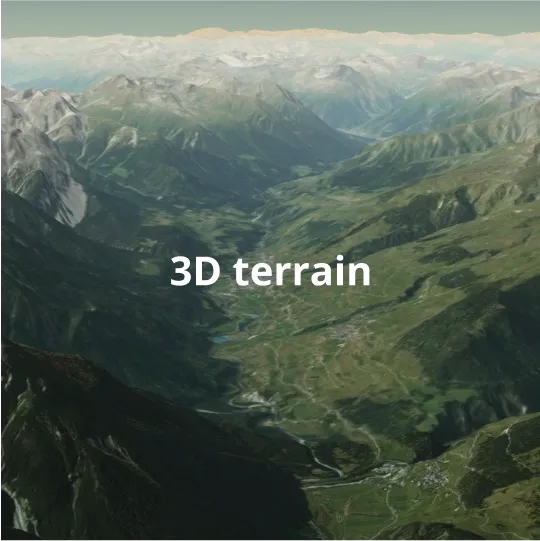
Maps for data storytelling
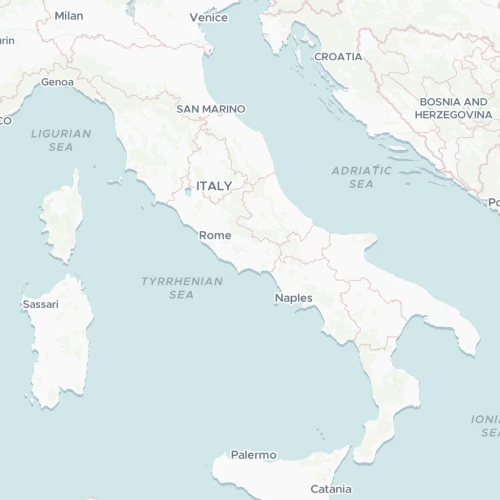
Neutral map styles designed to let your data stand out.

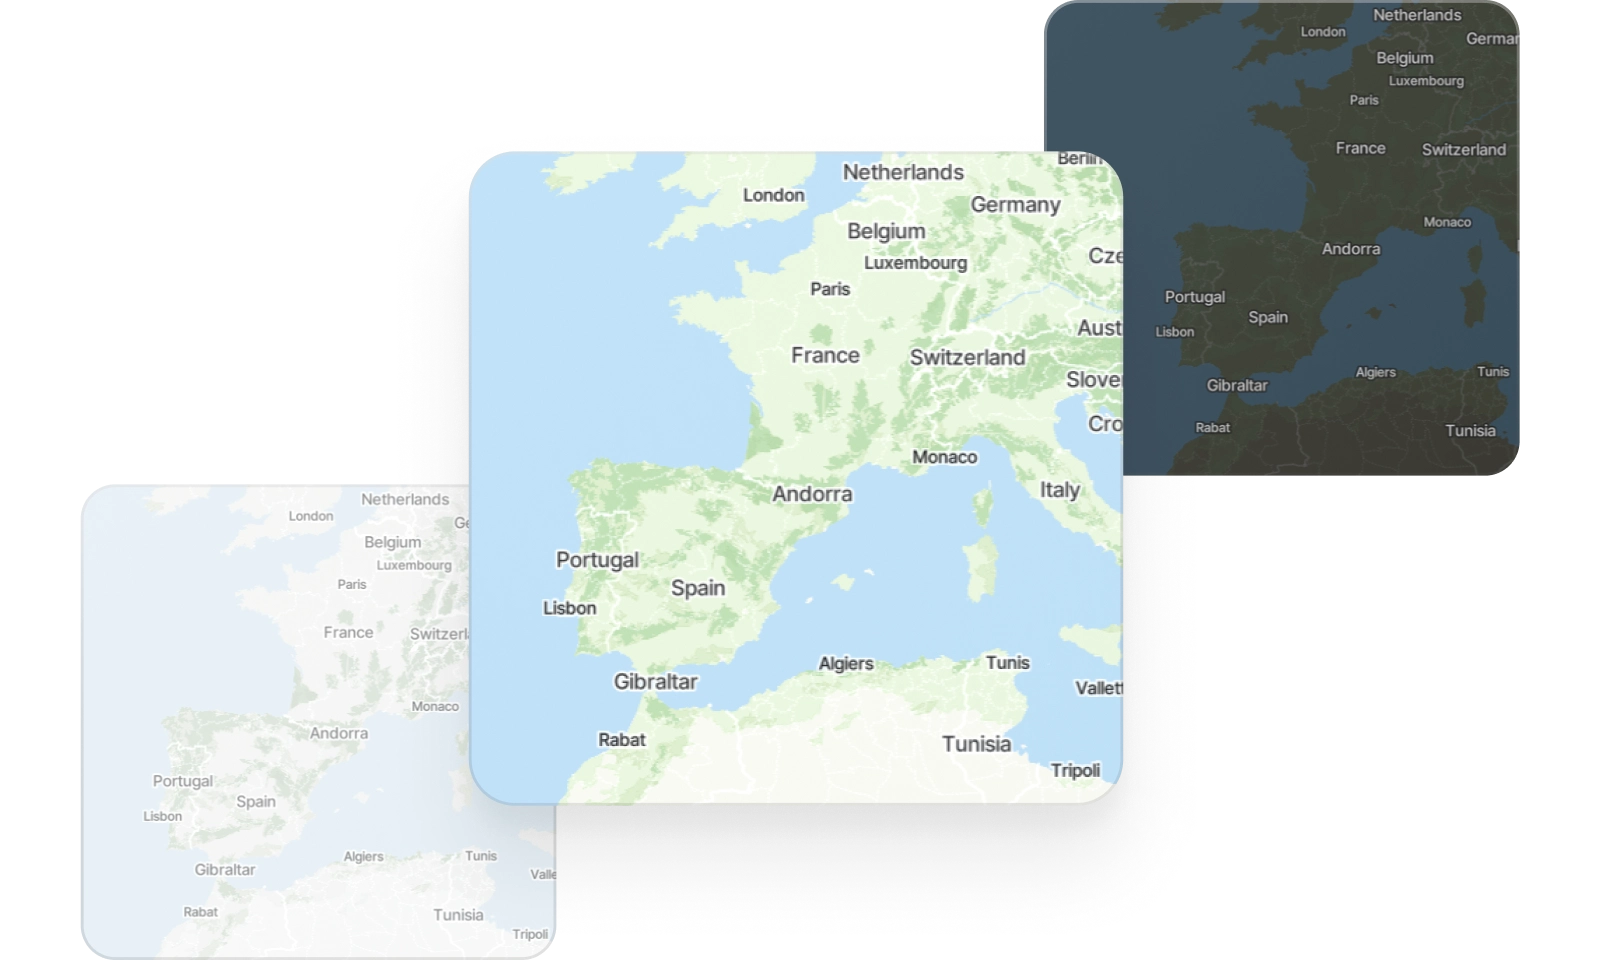
Minimal cartography
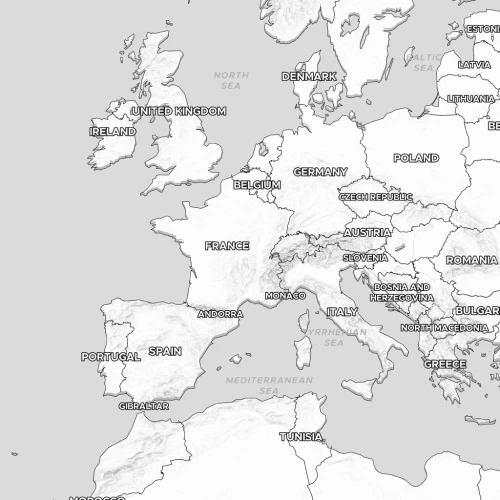
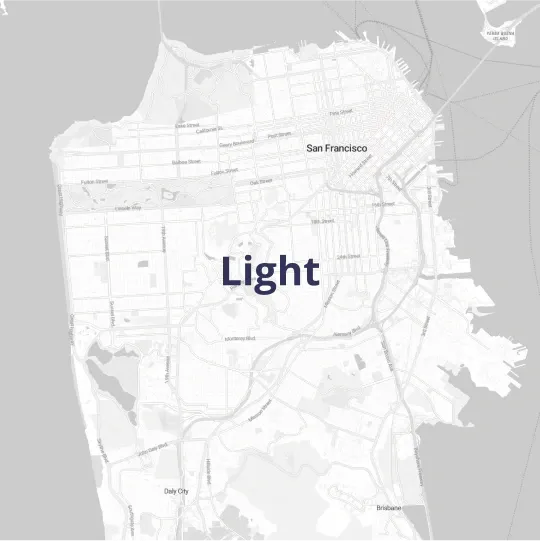
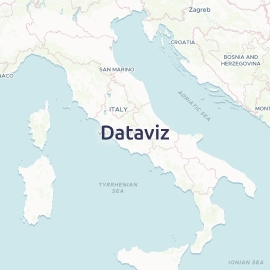
Non-intrusive design with few labels and muted colors lets your data be the star of the show.
Fast loading
Lightweight vector tiles ensure fast loading and smooth interaction even with large datasets.
Easy publishing
Seamlessly share and embed interactive maps in your applications and dashboards.
Cover any use case
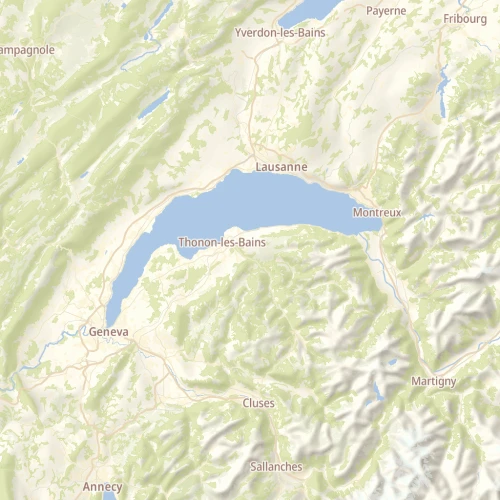
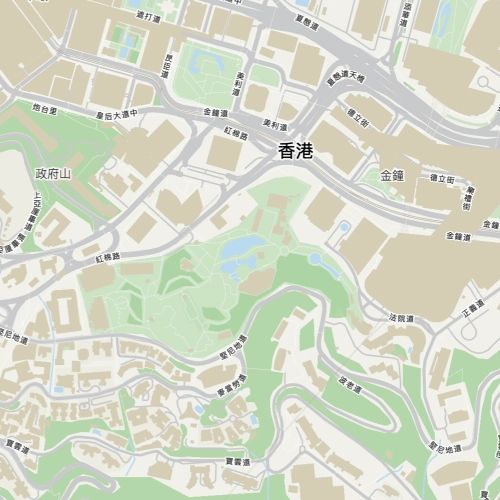
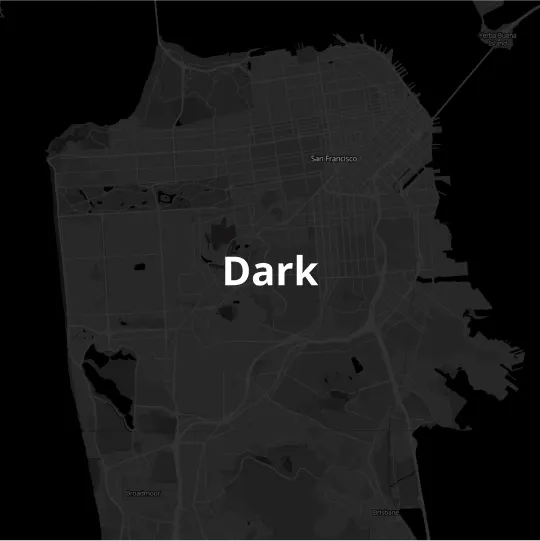
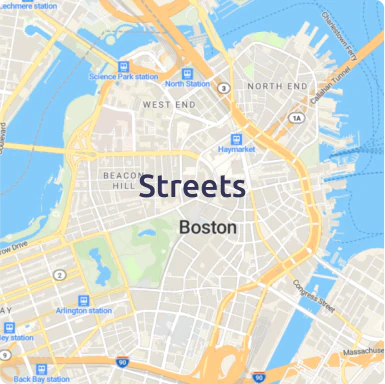
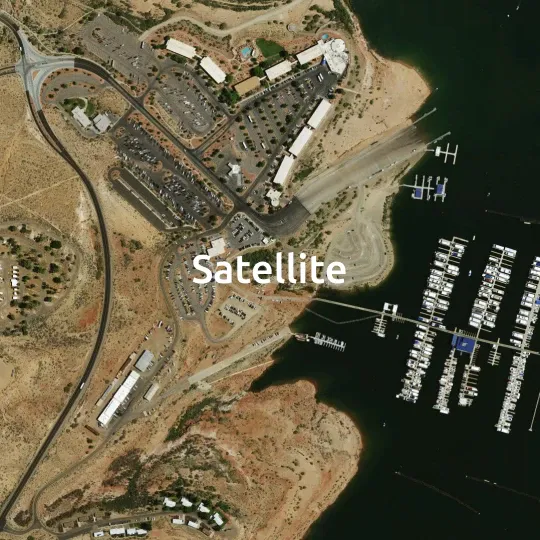
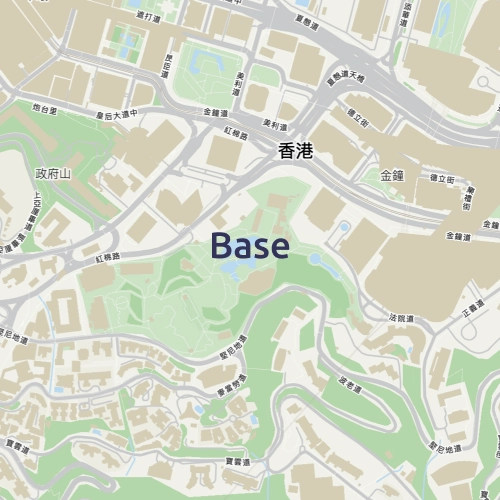
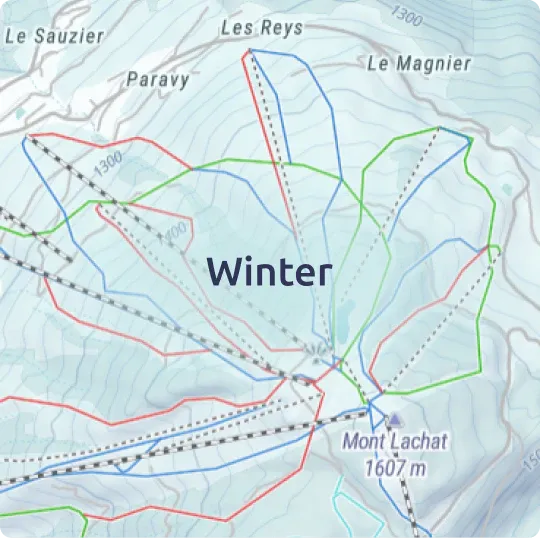
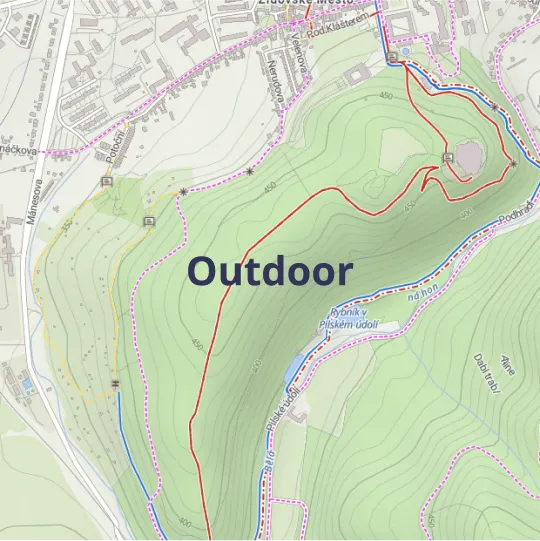
Choose from light, dark, and other color variations to get the basemap that complements your data visualization and matches your user preferences.
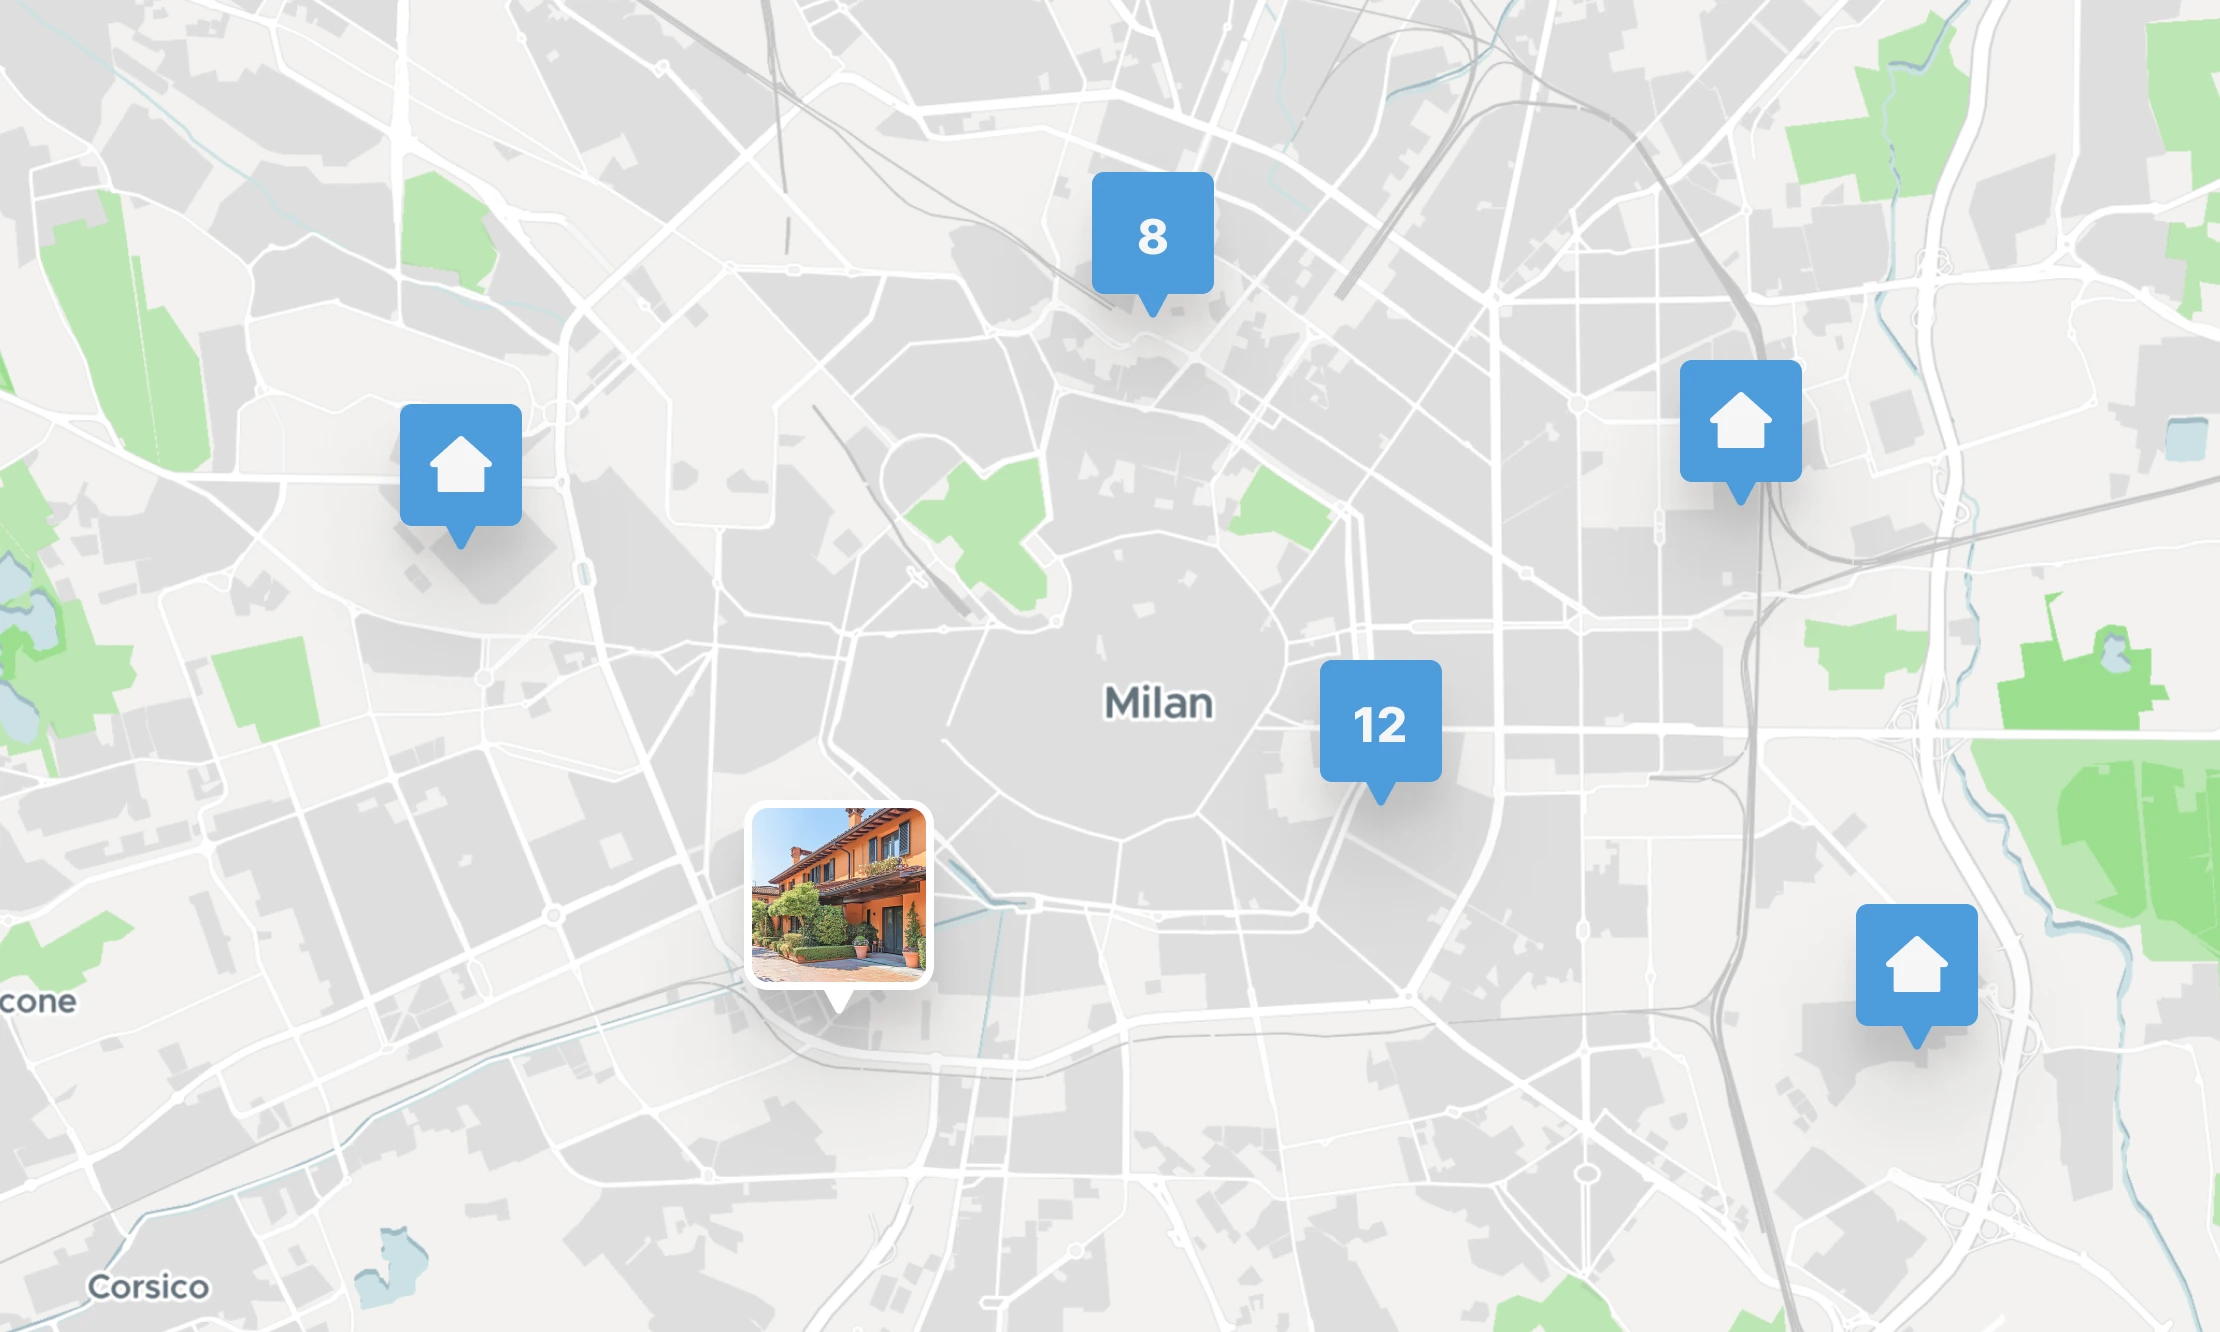
Visualize your data at scale
Our SDK provides an environment where you can easily combine basemaps with your data.
- Handles large datasets with ease
- Use on the fly heatmaps and clustering
- Add filters and other tools to perfect your visualisations
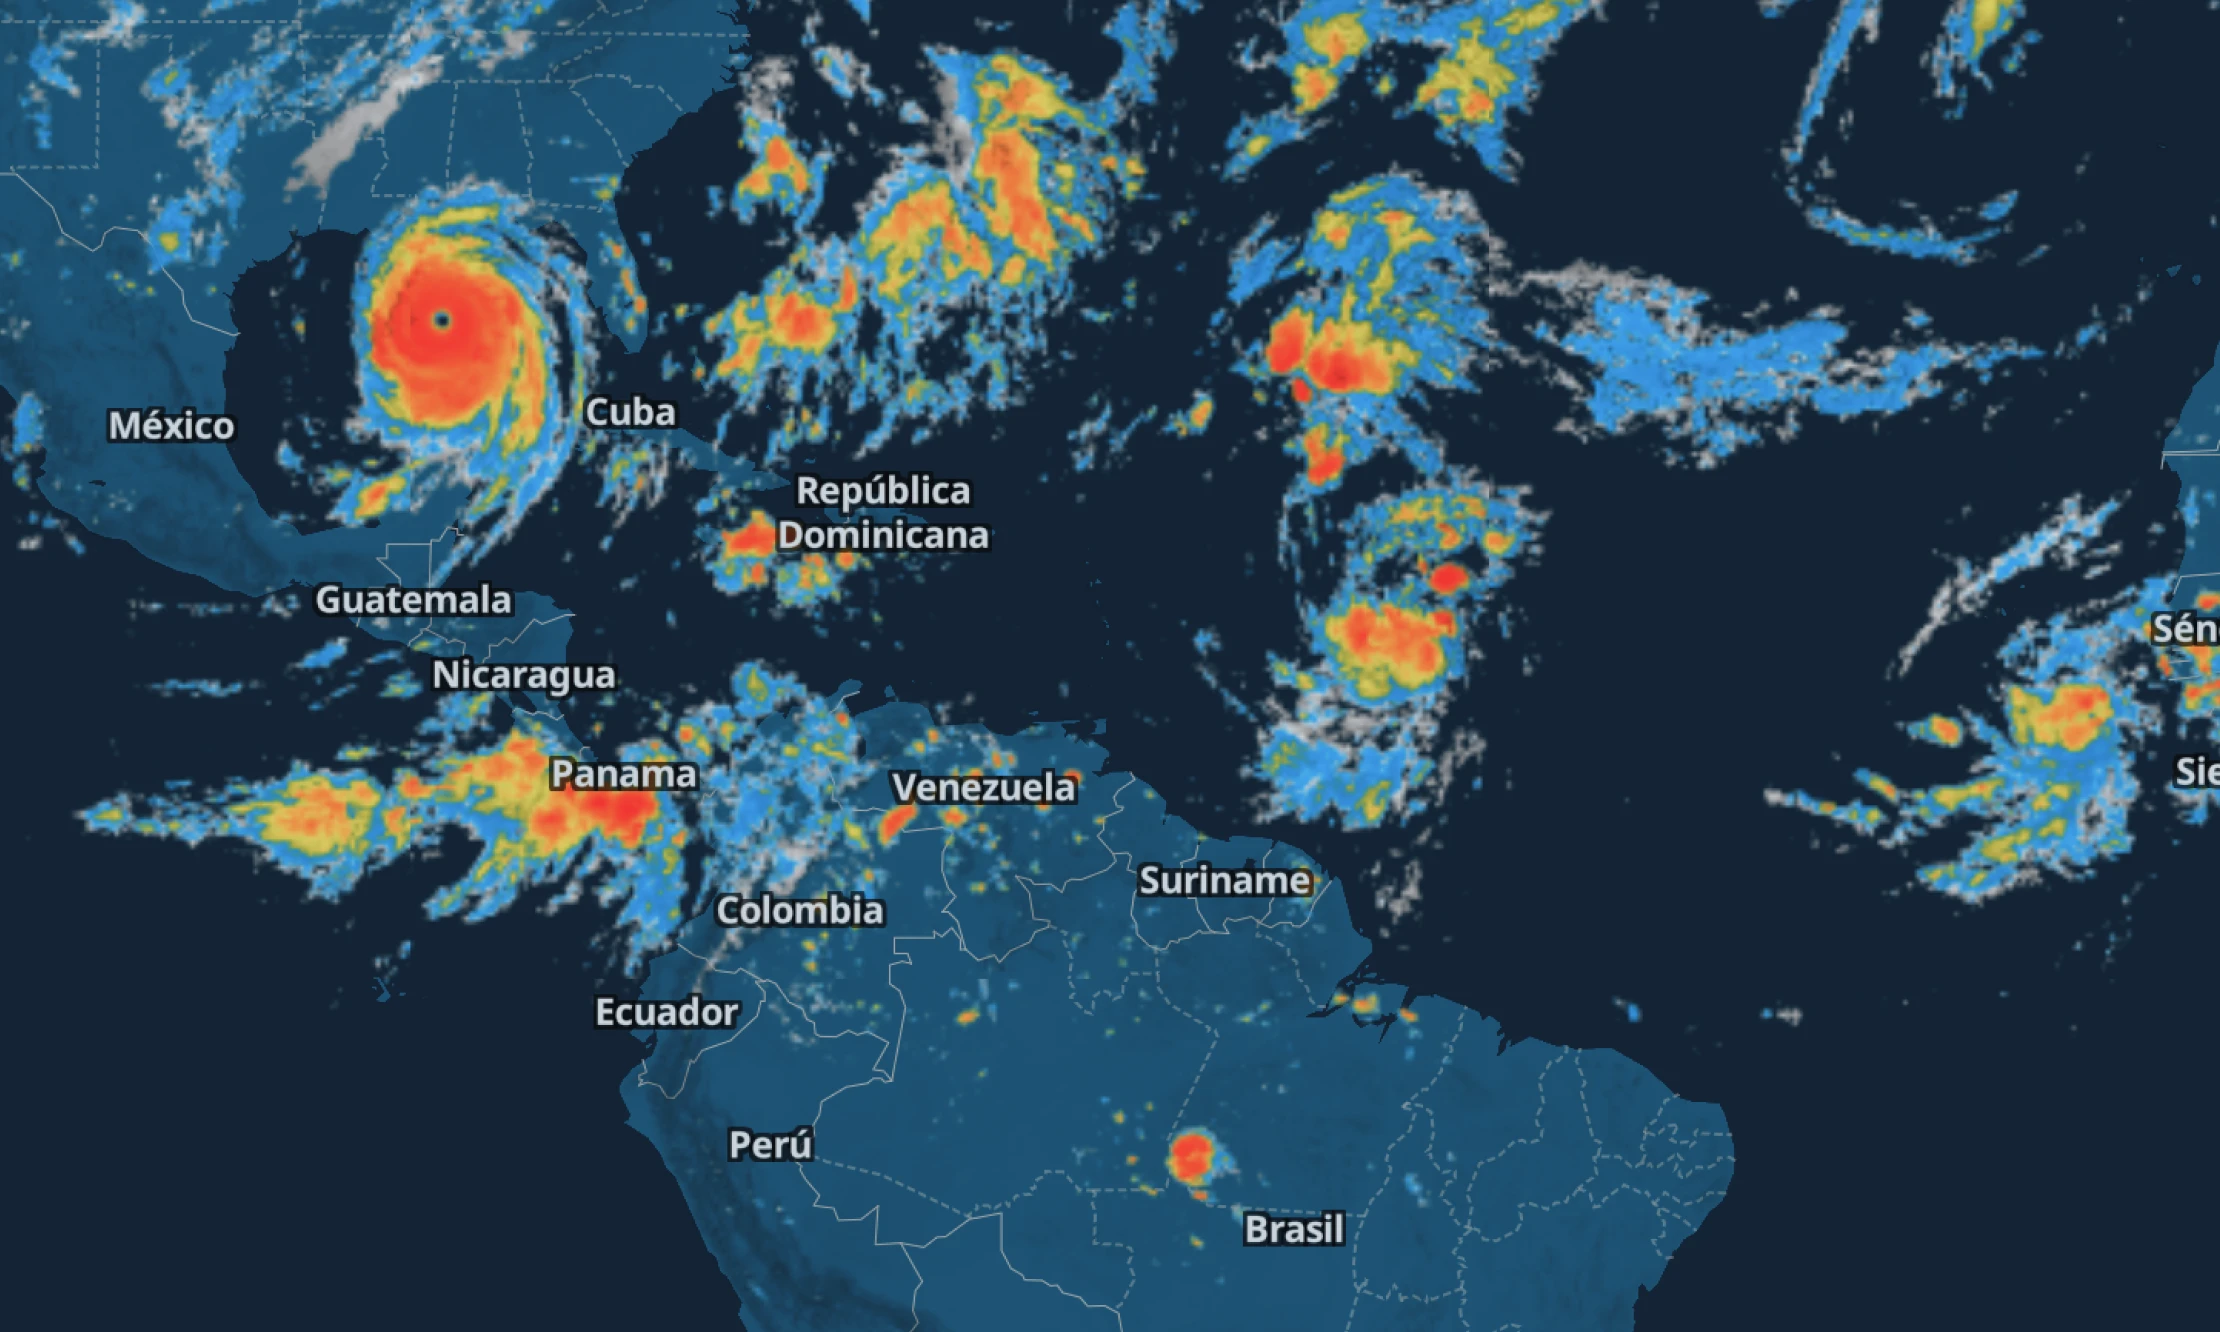
Display weather data
Bring real-time weather to life on interactive maps:
- Trusted by large organisations like wetter.com
- Built in weather layers or bring your own
- Ideal basemaps and advanced visualization technology
Available as

Raster tiles
Leaflet, OpenLayers, XYZ

Map services
WMTS and OGC Tiles API for QGIS or ArcGIS

Static maps
Image for thumbnails
Publish anywhere
Use maps on your website and apps, either from our cloud or your on-prem solution.

