Insurers call them acts of God, as if hurricanes, floods, wildfires, and earthquakes strike out of nowhere. On a map, however, they often follow clear spatial patterns. Let’s look at how maps help before, during, and after each type of disaster, and how organizations such as NOAA, PurpleAir, and the Icelandic Meteorological Office build their natural disaster maps.
What is an act of God?
An act of God is a natural event outside human control that couldn’t reasonably have been prevented, such as a severe storm, flood, lightning-caused wildfire, earthquake, volcanic eruption, or extreme heat. The term matters in two situations:
- Insurance: if an act of God damages your property, your insurance pays only if your policy includes that type of event.
- Business contracts: it usually means no one has to pay a penalty when a natural disaster makes a promise impossible to keep.
Natural disasters follow geography
No one can stop an act of God, but people can predict where it’s likely to strike and limit the damage. Most hazards keep returning to the same places: hurricanes hit the same coastlines every season, wildfires concentrate in dry, wind-exposed regions, floods follow elevation and river networks, and earthquakes and volcanoes cluster along plate boundaries. That’s why agencies publish risk datasets such as FEMA’s National Risk Index, essentially a natural disaster risk map of the US that scores every county for 18 natural hazards.
Maps support every phase of a disaster: assessing risk, forecasting and warning, responding, and recovering. Here are key examples of how maps are used:
1. Hurricanes: from forecast tracks to damage imagery
Before landfall, forecast maps show a hurricane’s predicted track as a cone that widens the further out it goes because long-range forecasts are less certain. There are also storm surge and evacuation zone maps that tell coastal residents whether and when to leave.
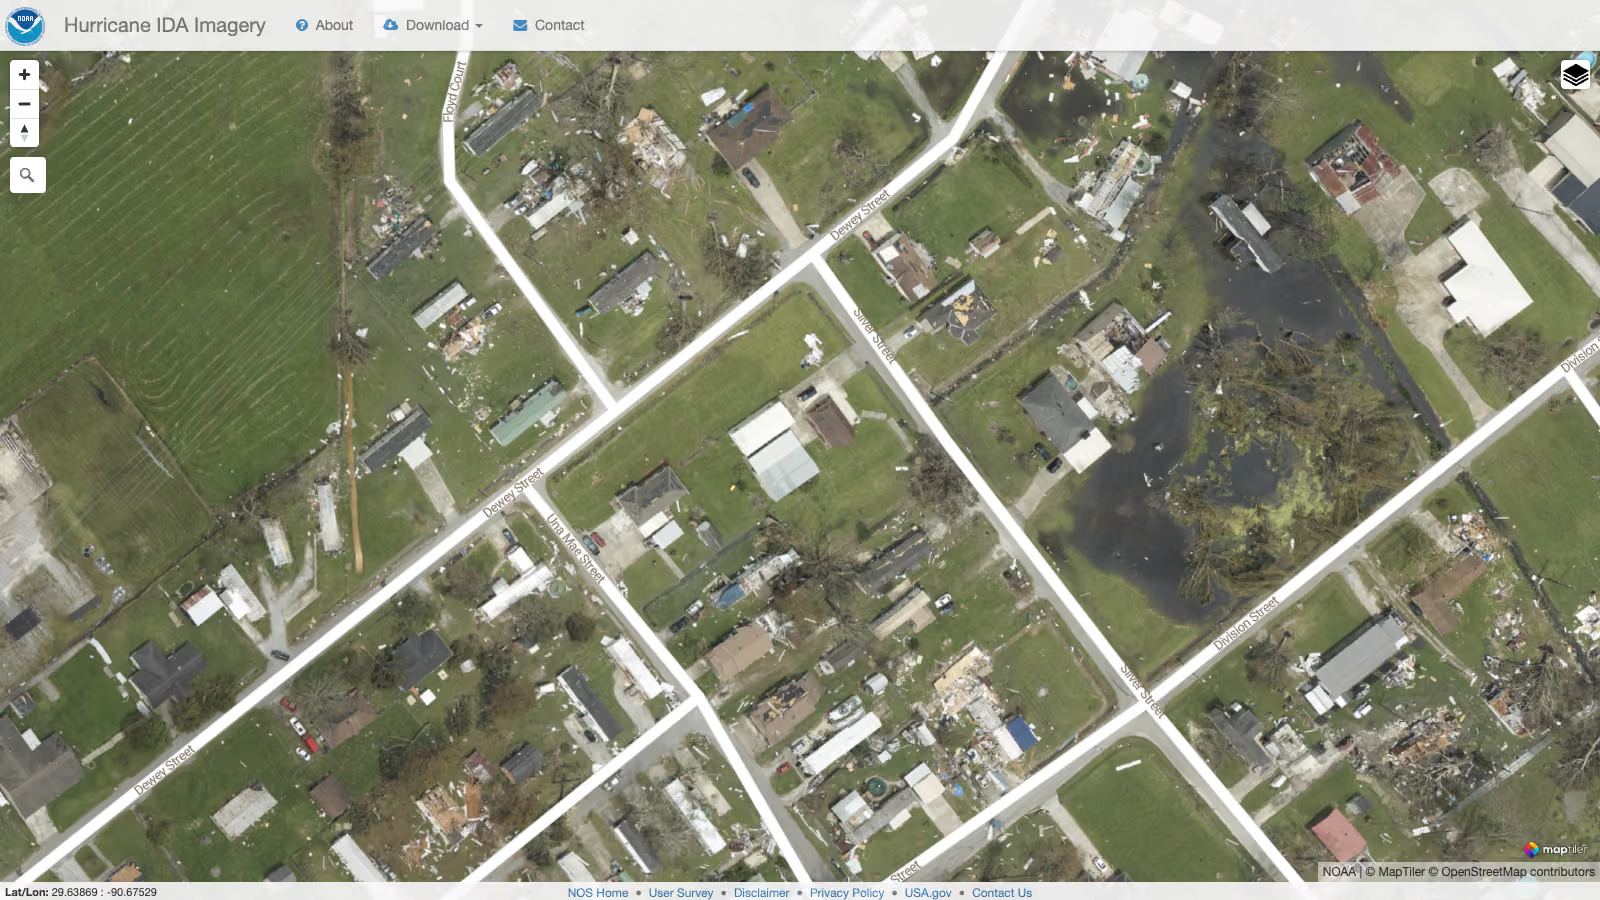
After the storm, aerial and satellite imagery shows the damage street by street. Emergency managers use it to prioritize the response, and insurers use it to verify claims.
2. Wildfires and smoke: hotspots, perimeters, and air quality
Wildfire maps combine satellite fire detections with fire perimeters mapped by fire agencies. With update frequencies reaching several times a day, satellites can flag hotspots and keep agencies up to date. Evacuation maps built on this data show which neighborhoods need to leave and which are no longer at risk. Even before the fire season starts, risk maps highlight the wildland-urban interface, where homes meet forest and grassland.
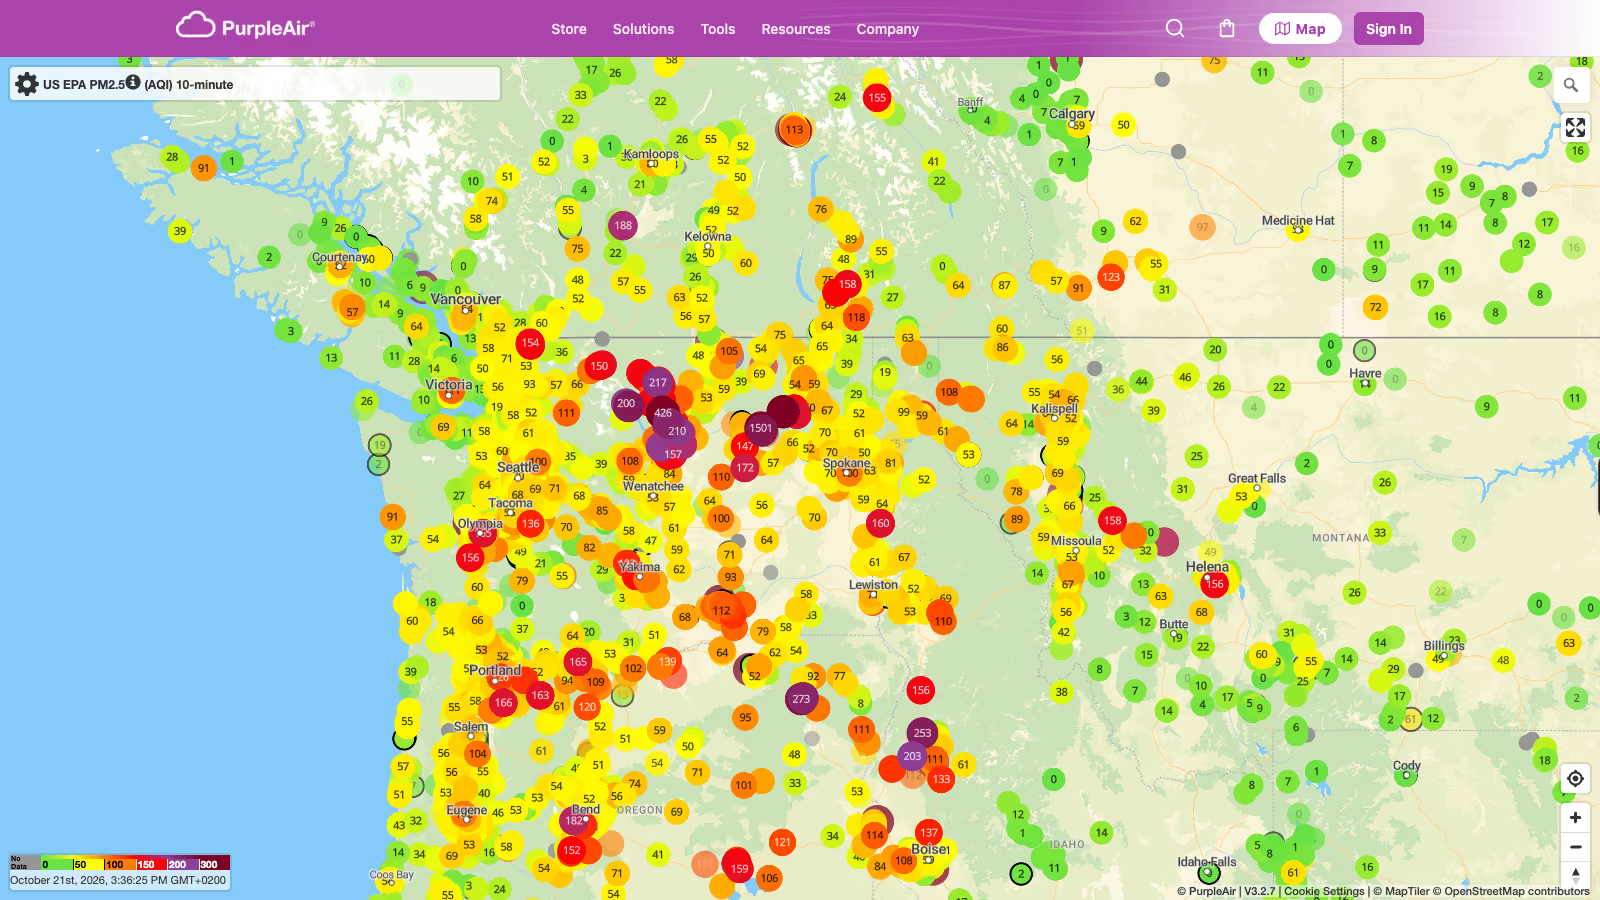
Smoke needs its own map, though. It can travel thousands of kilometers, so a wildfire smoke map fed by ground sensors and satellite data is relevant to far more people than the fire perimeter itself.
3. Floods: flood zones, warnings, and terrain
Flood zone maps are the basis of flood planning: they show which areas are likely to flood and shape insurance requirements and building regulations. During a flood, maps of river gauge readings and warnings show where water is rising. Afterward, drones capture detailed imagery of affected towns and river sections, while satellite radar, which sees through clouds, maps the full extent of the flooded area for response and recovery.
Terrain matters most, because water follows elevation. Land cover, soil type, and soil condition then determine whether rain soaks in or runs off quickly. With these key datasets, you can build an accurate picture of where the risk lies.
4. Earthquakes, volcanoes, and tsunamis: hazard zones and real-time events
Earthquakes can’t be forecast, but hazard maps show where strong shaking is likely based on fault lines and past events. Geological data can also predict how shaking is likely to affect the buildings above. When an earthquake strikes, real-time maps show the epicenter within minutes, and intensity maps estimate how strongly people felt it in each area to guide response teams.
Earthquakes and eruptions under the sea or near the coast, as well as large landslides into the water, can trigger a tsunami. Coastal hazard maps mark the areas a tsunami could flood and the evacuation routes to higher ground. When a warning goes out, maps show estimated arrival times and wave heights along the coast, sometimes only minutes before the first wave hits.
On the ground, volcano maps show lava flow paths and exclusion zones, and terrain decides where lava and mudflows are most likely to go. In the air, ash cloud maps follow the wind patterns, which carry the ash at different altitudes and determine which flight routes need to divert or close.
5. Extreme weather: forecasts, radar, and heat
Storms, heavy rain, heatwaves, and cold snaps are among the most common extreme events. Weather services publish forecast maps of wind, precipitation, and temperature, radar maps of approaching rain, and regional warning maps. For heatwaves, urban heat island maps show the hottest city districts and help cities plan cooling measures and greenery planting.
How organizations map disasters with MapTiler
You can see how maps assist in each phase of these natural disasters, from risk to recovery, in real projects. Here are a few built with MapTiler.
NOAA: post-hurricane aerial imagery
After each major storm, NOAA’s National Geodetic Survey publishes its aerial survey photos as Emergency Response Imagery. The challenge is volume and timing: thousands of new aerial photos must go online right after the storm, exactly when help is needed most. Since Hurricane Matthew in 2016, NOAA has used MapTiler to turn the photos into map tiles that load quickly at any zoom level and can serve hundreds of thousands of visitors.
PurpleAir: wildfire smoke map
PurpleAir runs a crowdsourced network of over 35,000 low-cost air quality sensors. Their particulate matter readings stream to a public map built on MapTiler. During the 2020 wildfire season, daily traffic grew 1,000-fold, and local safety departments used the map to decide on school closures.
Icelandic Meteorological Office: weather, earthquakes, and volcanoes
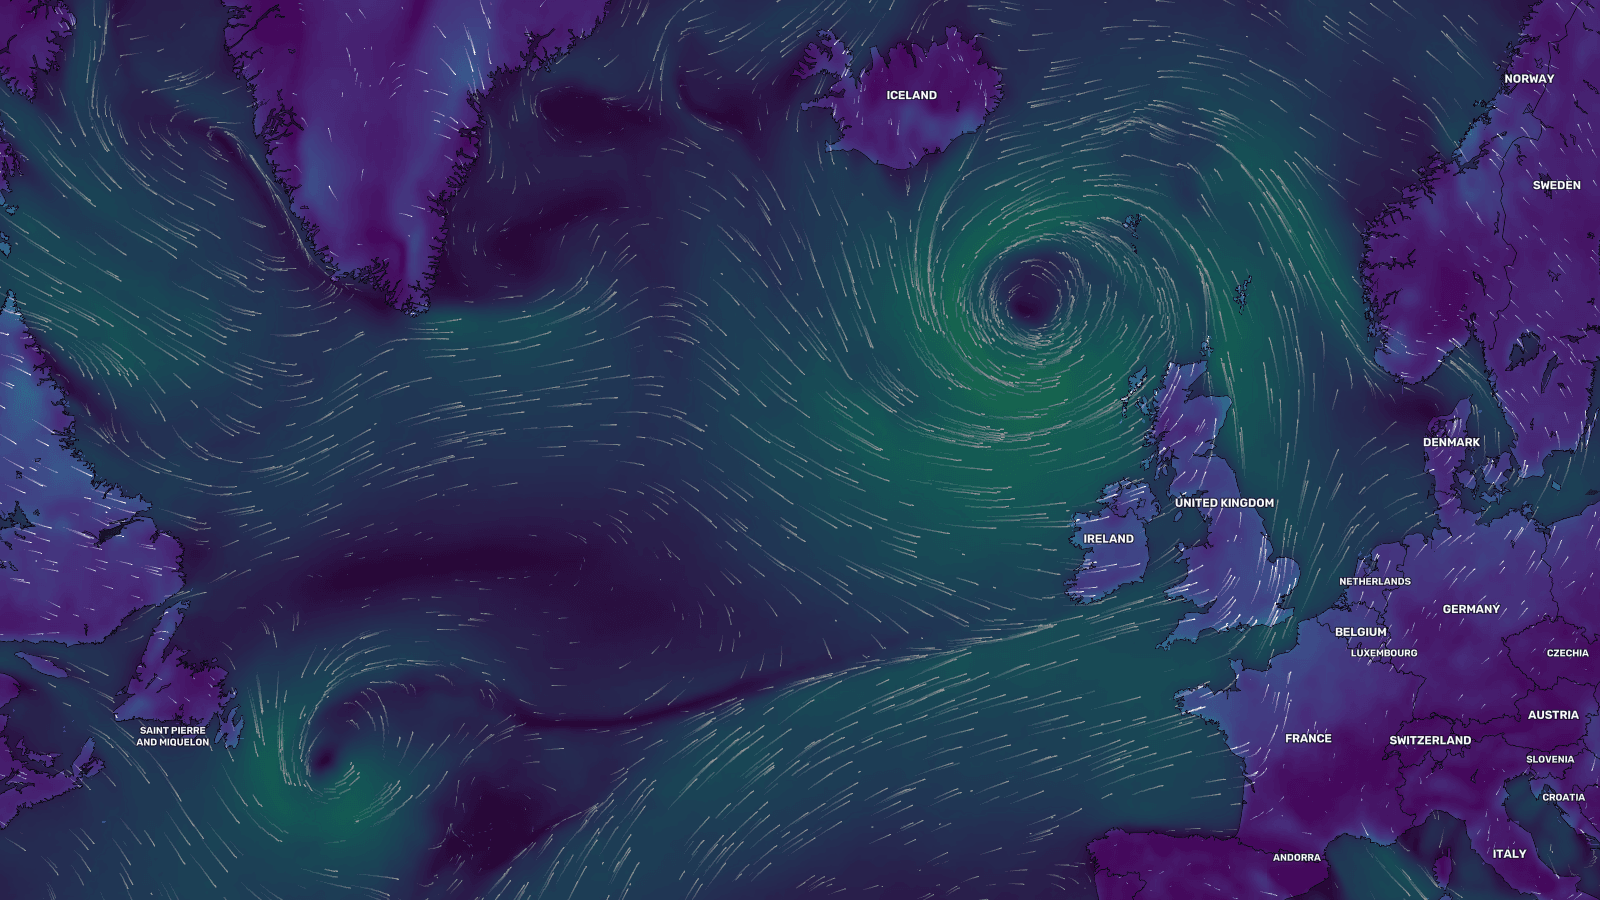
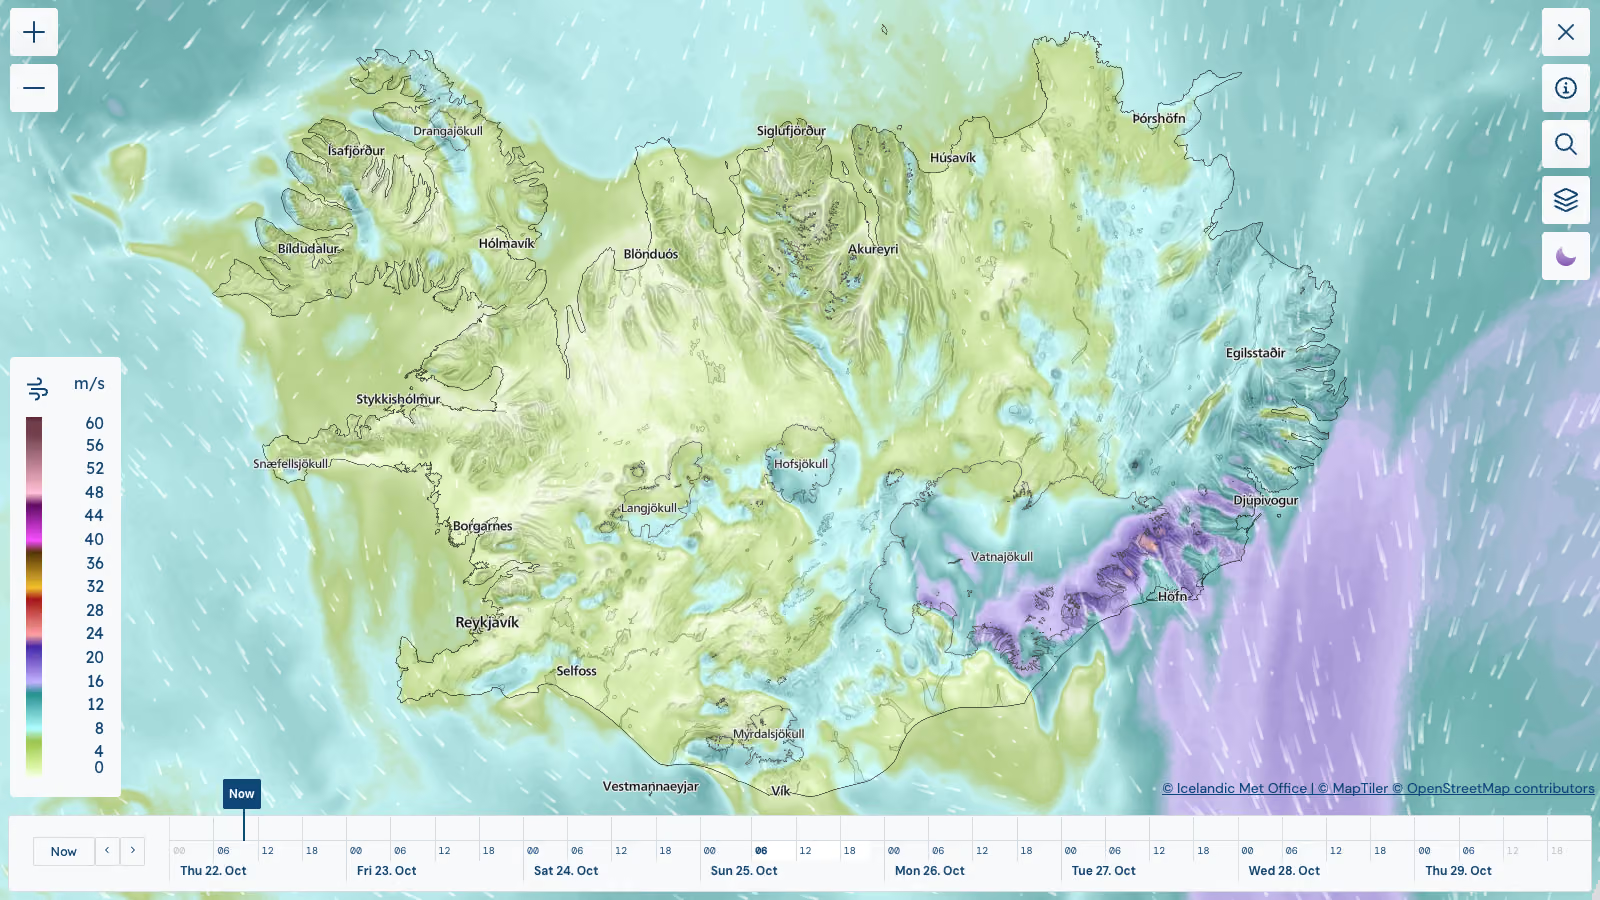
The Icelandic Meteorological Office monitors storms, earthquakes, volcanic eruptions, avalanches, and landslides. The weather map combines a custom MapTiler map style and terrain with MapTiler Weather layers for wind, temperature, and precipitation, fed with the office’s own forecast data. The earthquake map uses a custom outdoor style with contour lines and terrain, which puts seismic events in the context of the volcanic landscape.
Weather services: forecasts, 3D radar, and heat
The National Center of Meteorology of the UAE developed Rain.ae carried out R&D in cooperation with MapTiler, including visualizing 3D radar of past, current, and forecast clouds with a tool for inspecting storm structure.
The Weather Network, Surfline, wetter.com, and the Met Office use MapTiler maps in their forecast products, and Urban Heat uses them to map heat islands in European cities.
How to build a natural disaster map
Most disaster maps combine three layers:
- Base map: a neutral light or dark style keeps hazard data readable. Add satellite imagery for ground truth and terrain for floods, wildfires, and volcanoes.
- Hazard data: official datasets from FEMA, NOAA, USGS, or national agencies, served as GeoJSON or vector tiles. Your own aerial or drone imagery can be tiled and added as a raster layer, the way NOAA does it.
- Live conditions: weather layers for wind, precipitation, temperature, and radar.
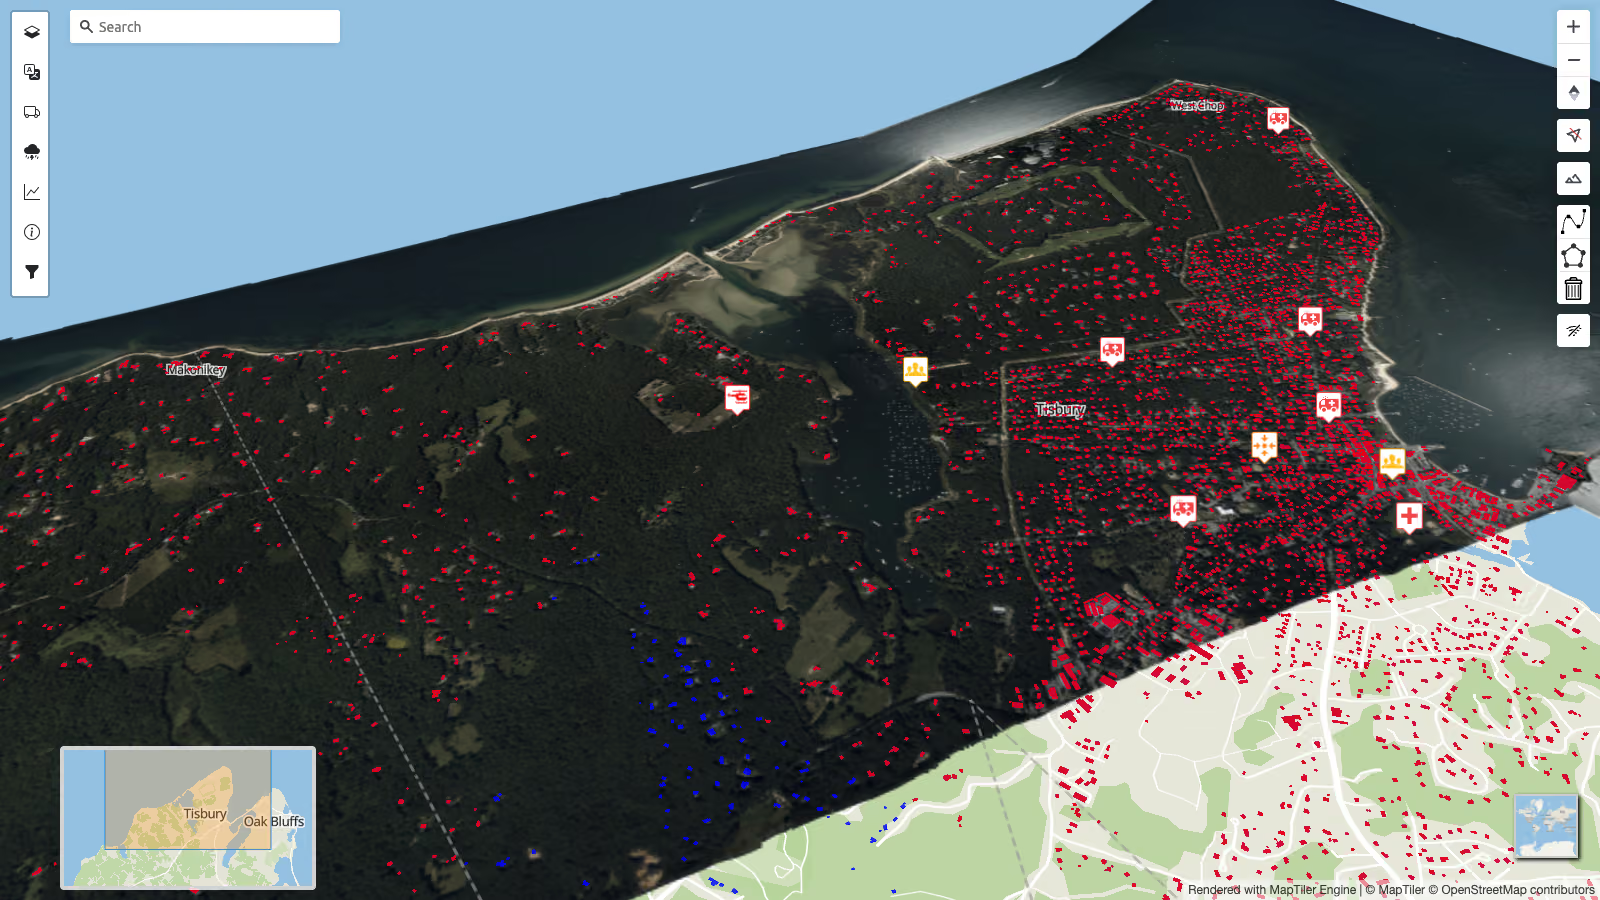
The Natural Disaster demo shows the full setup in a custom portal built with the MapTiler SDK.
Start building
Combine MapTiler maps, terrain, and weather layers with your own hazard data.